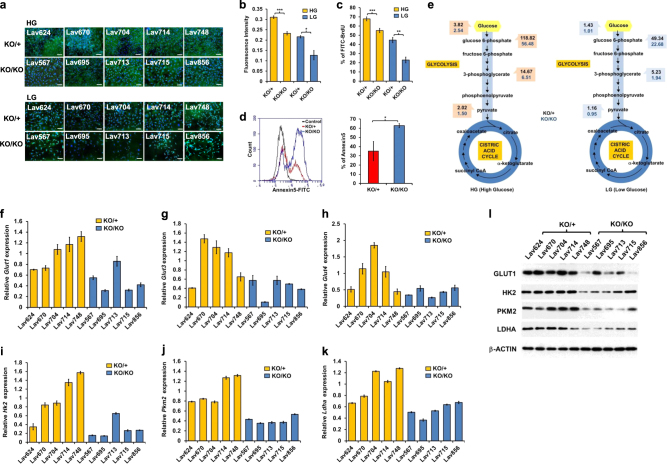
Fig. 1.
Retarded glucose metabolism in miR-155ko/ko mammary tumor cells. a CellMask plasma membrane/DAPI stain images of miR-155ko/+ or miR-155ko/ko cells cultured in media with high glucose (HG) or low glucose (LG) for 3 days (scale bar: 200μM). b Cell proliferation assay results after culture in HG (in yellow) or LG (in blue) media for 3 days. AlamarBlue assay was performed using a fluorescence spectrophotometer. ***p < 0.001 c BrdU cell proliferation assay results measured by Flow Cytometry (See Methods). The portion of BrdU positive cells were indicated as yellow (HG) or blue bar (LG). ***p < 0.001 d Left: representative picture of Annexin-V apoptosis assay results. The Annexin-V positive cells were indicated as red (for KO/+) or blue (for KO/KO). Right panel shows a graph for the AUC (area under curve) value of the left panel. Error bar means ± SEM (n = 5). e Graphical presentation of LC-MS/MS results by flow diagram, showing glucose and its metabolite levels of miR-155ko/+(marked in black numbers) or miR-155ko/ko (marked in blue numbers) cells cultured in HG (left) or LG media (right). f–k qRT-PCR analysis of Glut1 (f), Glut3 (g), Glut4 (h), Hh2 (i), Pkm2 (j) and Ldha (k) genes. Data were normalized to human RPL13a level. Error bar means ± SEM (n = 3). *p < .0.05, **p < 0.01, ***p < 0.001 (l). Western blot results of GLUT1, HK2, PKM2, and LDHA proteins in miR-155ko/+ or miR-155ko/ko cells. β-ACTIN was used as loading control

