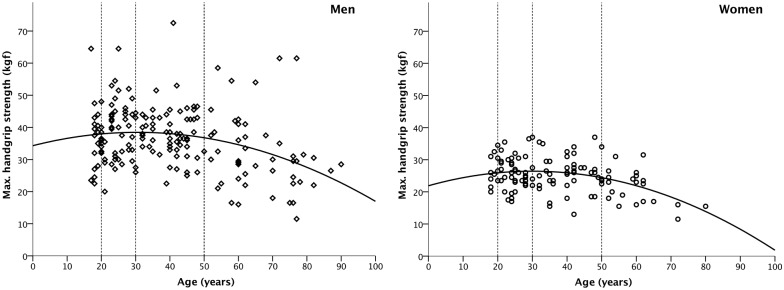
Fig 1. Scatterplot of handgrip strength as a function of age, separately for Maasai men (left) and women (right).
Cut-off points for the two age groups included in the shape analysis are indicated with vertical, dashed lines. The curved line is the quadratic regression of physical strength on chronological age (men: R2 = 0.10, n = 183; women: R2 = 0.14; n = 118).

