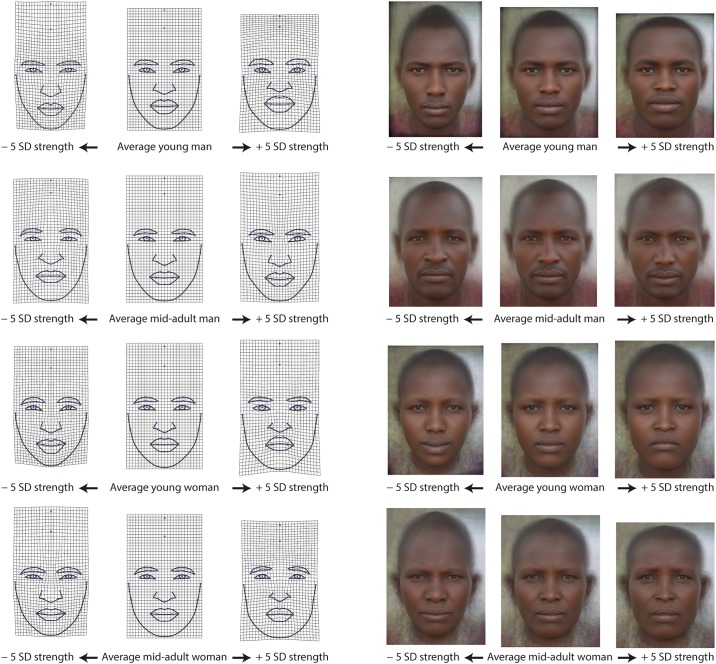
Fig 3. Facial shape correlates of handgrip strength (HGS) in the Maasai.
Thin-plate spline deformation grids (on the left) depict the facial shape changes with HGS as deformations from the average facial configuration (middle column) to −5 SD of HGS (left column) and to +5 SD (right column), separately for each sex-age group. This magnification factor was applied to facilitate interpretation. The same facial configurations were also visualized through image unwarping and averaging (on the right). Thin-plate spline deformation grids and facial morphs were aligned at the height of the pupils and scaled for interpupillary distance.

