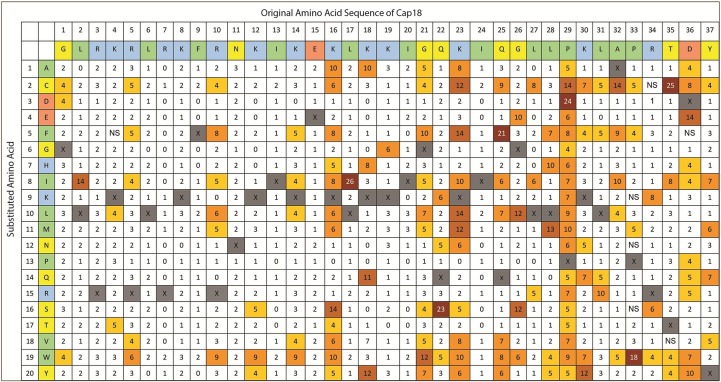
Fig 6. Complete Substitution Analysis of Cap18 measuring the hemolytic activity of Cap18 peptides against horse erythrocytes.
The original Cap18 sequence (GLRKRLRKFRNKIKEKLKKIGQKIQGLLPKLAPRTDY) and amino acid assignments are presented in the first two rows. The second column identifies the amino acid substitution at each position (A-Y). Each box in the matrix represents a Cap18 peptide harboring one single amino acid substitution compared to the original Cap18 sequence. For example, the amino acid sequence of the peptide in column 1/row 1 is ALRKRLRKFRNKIKEKLKKIGQKIQGLLPKLAPRTDY, the sequence of the peptide in column 1/row 2 is CLRKRLRKFRNKIKEKLKKIGQKIQGLLPKLAPRTDY, the sequence of peptide in column 2/row 1 is GARKRLRKFRNKIKEKLKKIGQKIQGLLPKLAPRTDY etc.; the values within each box represent the hemolytic activity measured relative to full lysis by 0.2% Trition X-100. The final peptide concentration in the assay is 32 μg/ml. Grey boxes with X represent the original Cap18 sequence. NS = no MIC value determination possible due to the insolubility of the peptide in DMSO.

