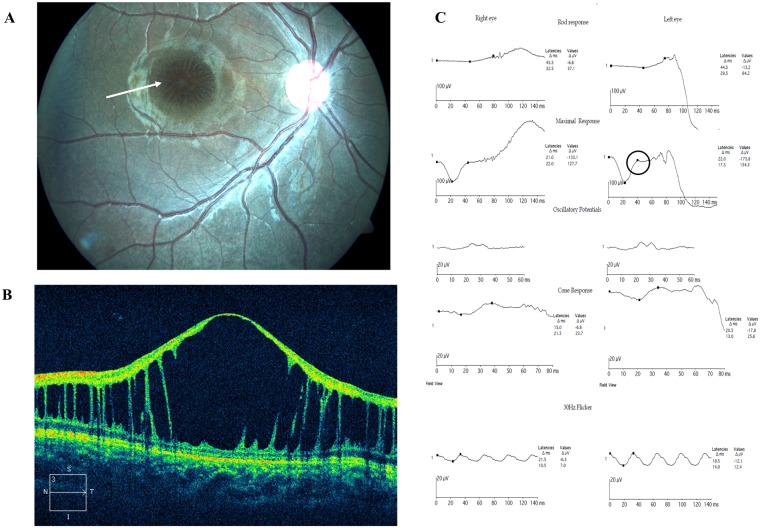
Fig 1. Representative clinical images and data of XLRS patients.
(A) Fundus exhibiting spoke wheel pattern like schisis at the macula (indicated by arrow). (B) Optical coherence tomography showing splitting of the inner retinal layers. (C) Electroretinogram showing reduced waveforms of rod and cone responses, a negative b-wave pattern noted on standard combined response (circled).

