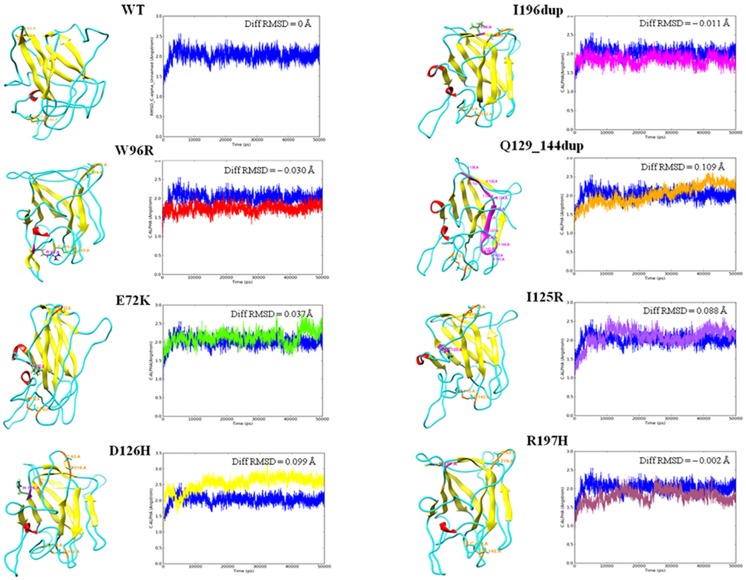
Fig 2. Tertiary structure and RMSD graph of WT and RS1 mutants inferring differences in backbone stability.
In the tertiary structure, helices are shown in red, sheets in yellow, loops in cyan, mutation spots in magenta with the residue label and disulphide bonds in orange colour. Diff RMSD value (Å) specified in each graph represents the average difference in the RMSD value (Å) of every mutant in comparison to the wild type.

