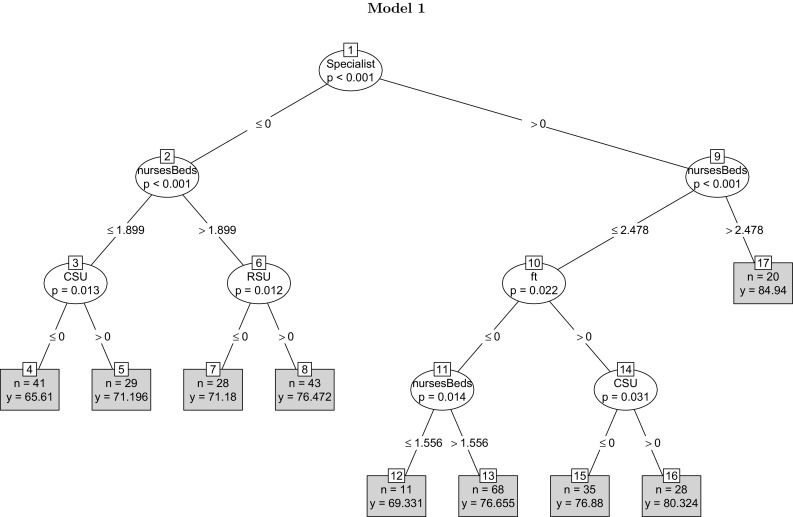
Fig. 2.

The tree includes variables capturing hospital characteristics, human capital factors, teaching and foundation trust status, and primary variables reflecting the quality of the organisation of the process of stroke care. The higher a variable appears in the tree structure, the more predictively significant the variable will be. The organisational variable ‘Specialist’ appears at the initial node of the tree as the predictively most important variable. Each box in the terminal nodes show two figures, the first (n) stating the number of observations falling in the branch and the second (y) giving the mean value of the observations in the branch. Hospitals with the highest quality score fall in the branch where the value of the dummy "specialist" equals one and the nurse-to-bed ratio exceeds 2.478
