
Fig. 1.
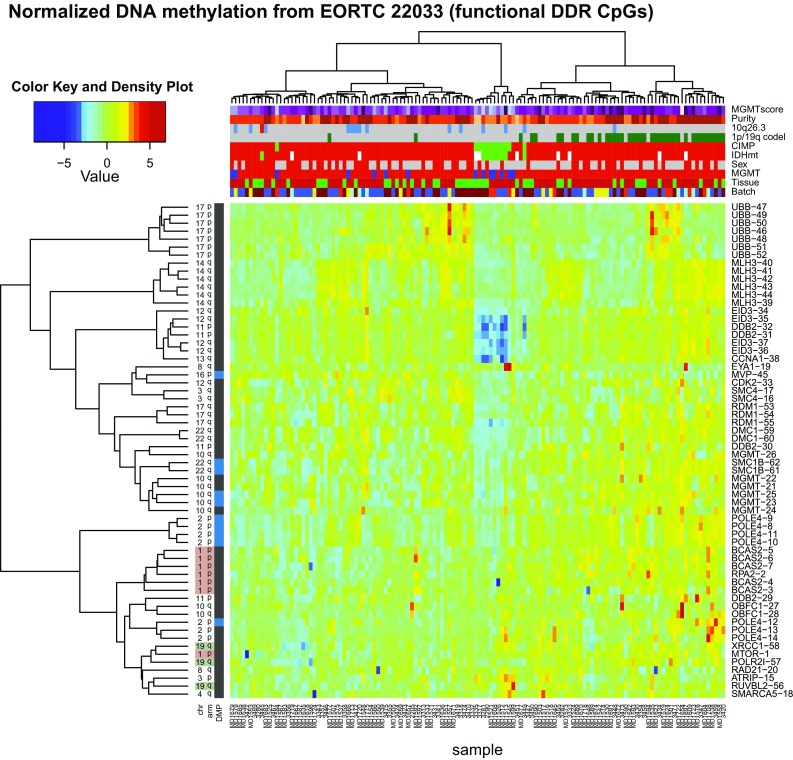
Heatmap representation of normalized DNA methylation of the 62 functional DDR CpGs in EORTC 22033. The dendrogram was established by hierarchical classification using Ward’s algorithm and Euclidean distance. Annotation of the 132 LGG samples comprises: MGMT methylation score (purple–blue color gradient, higher score more purple), purity estimation (HMP index, orange color gradient, more pure, more dark), copy number status for 10q26.3 region (grey, no change; red, amplification; blue, deletion), 1p/19q codeletion status (green, codeleted; grey, non-codeleted), CIMP status (green, non-CIMP; red, CIMP), IDH1 and IDH2 mutation status (green, wild type; red, IDH mutated; white, not determined), sex (red, female; grey, male), DNA methylation status of MGMT (MGMT-STP27, unmethylated, blue; methylated, red), tissue type (green, frozen; red, FFPE) and Batch (different colors). The 62 functional DDR CpGs are indicated on the right. The corresponding probe names are listed in supplementary Table S2 (Online Resource 2). The location on the chromosome (chr) arm, and the status as differential methylation position (DMP, blue; differentially methylated between codeleted and non-codeleted tumors) are indicated on the left