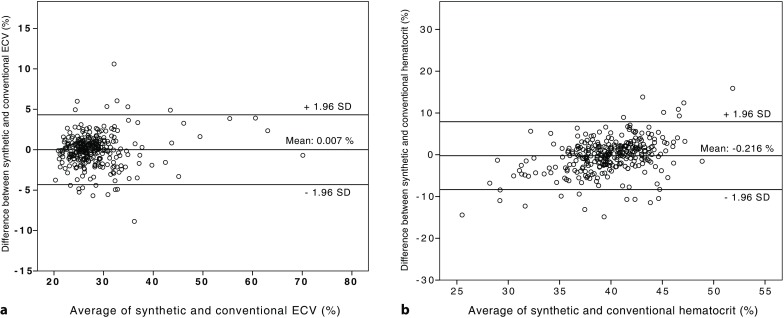
Fig. 3.

Bland-Altman plot for agreement between synthetic and conventional extracellular volume (ECV) (a) as well as between synthetic and conventional hematocrits (b) in the validation cohort. Mean difference was 0.007% with limits of agreement between −4.32 and 4.33% for ECV (a) and −0.216% with limits of agreement between −8.34 and 7.91% for hematocrit (b)
