
Figure 3.
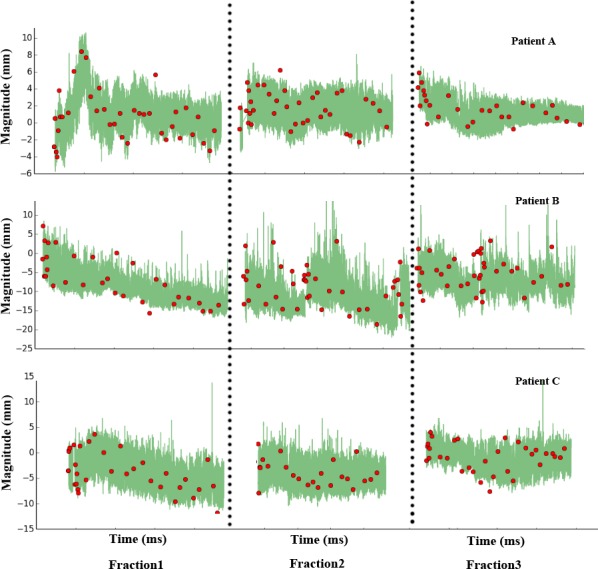
Intra‐ and interfraction motion variations in the SI direction of the first three fractions from three representative patients. The green lines are the tumor motion excursions extracted from the correlation model. The red points are the tumor positions acquired from an orthogonal X ray image system during the treatment delivery.