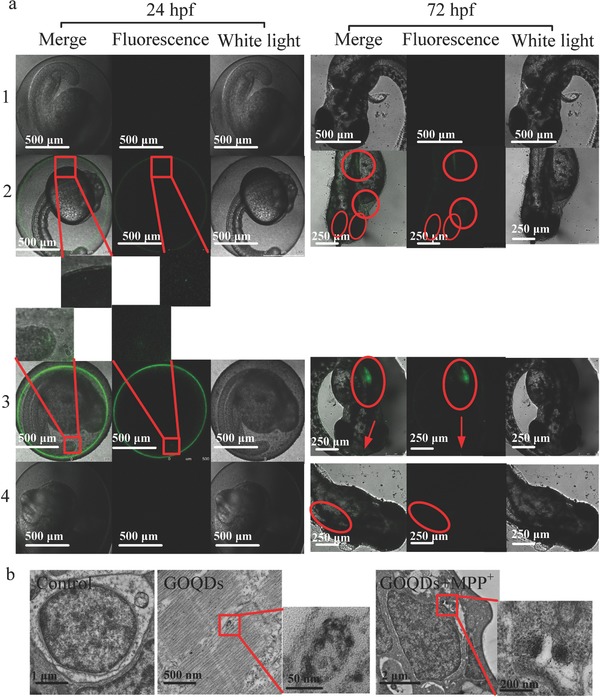
Figure 4.

Translocation of GOQDs to zebrafish. a) LSCM images of zebrafish treated with E3 medium (1), FITC‐GOQDs (2), FITC (3), and GOQDs (4) at 24 and 72 hpf. The green fluorescence dots in the embryos at 24 hpf are denoted by red rectangles, and the enlarged ones are shown below. The green fluorescence in the larvae at 72 hpf is denoted by red arrows and circles. b) TEM images of cell brains in zebrafish. Red rectangles indicate the black dots (GOQDs) in the cells, and the pictures on the right are enlarged.
