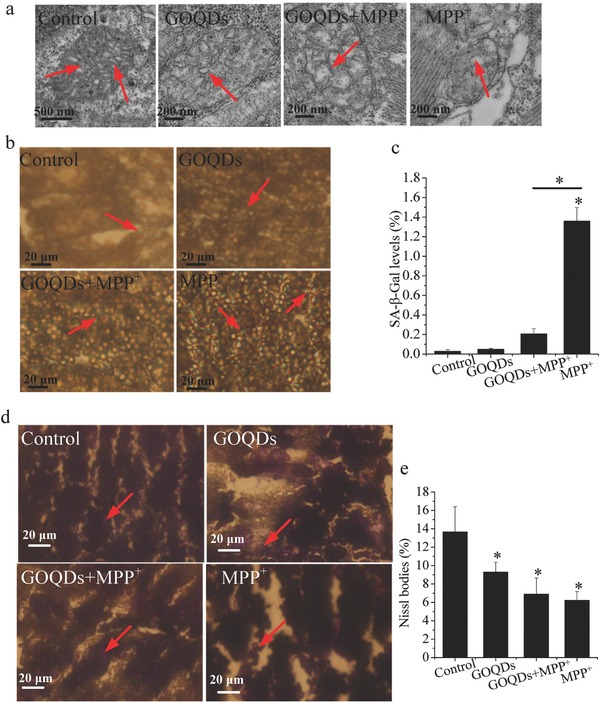
Figure 7.

Effects of GOQDs on MPP+‐induced neuropathological responses in vivo. a) TEM images of mitochondria in the brain cells of zebrafish. Red arrows denote the internal crista structures of the mitochondria. b) Senescent cells stained with senescence‐associated β‐galactosidase in the ventral diencephalon of the larvae. The blue cells indicated by red arrows are senescent cells. c) Ratios of senescent cell areas to brain section areas. d) Nissl staining images of larvae brains. The purple cells denoted by red arrows are Nissl bodies. e) Quantification of Nissl bodies in the brains of the larvae. *P < 0.05, compared with the control. * P < 0.05, GOQDs‐pretreated group compared with the MPP+‐treated group.
