Figure 6.

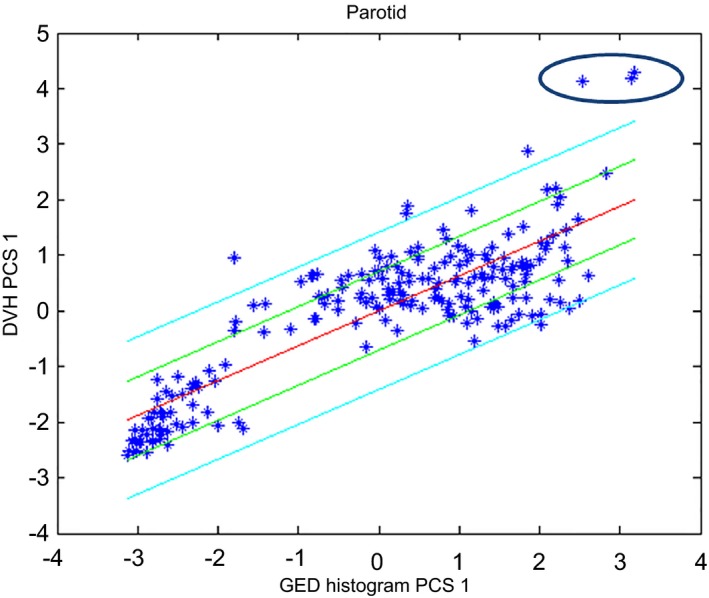
Scatter plot for the parotids for the first HN model. Plans whose parotids overlapped with the target are encircled in the upper right corner.

Scatter plot for the parotids for the first HN model. Plans whose parotids overlapped with the target are encircled in the upper right corner.