Figure 12.

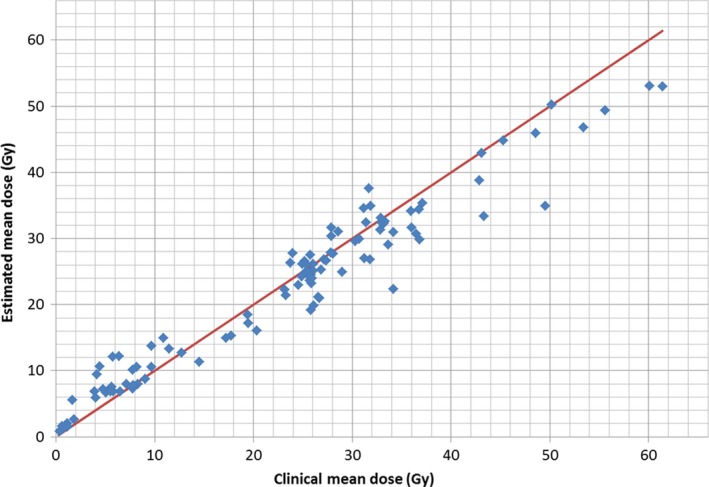
Comparison of the estimated mean doses for the parotids glands and the mean doses of the validation plans clinically used. An identity line is also shown for comparison.

Comparison of the estimated mean doses for the parotids glands and the mean doses of the validation plans clinically used. An identity line is also shown for comparison.