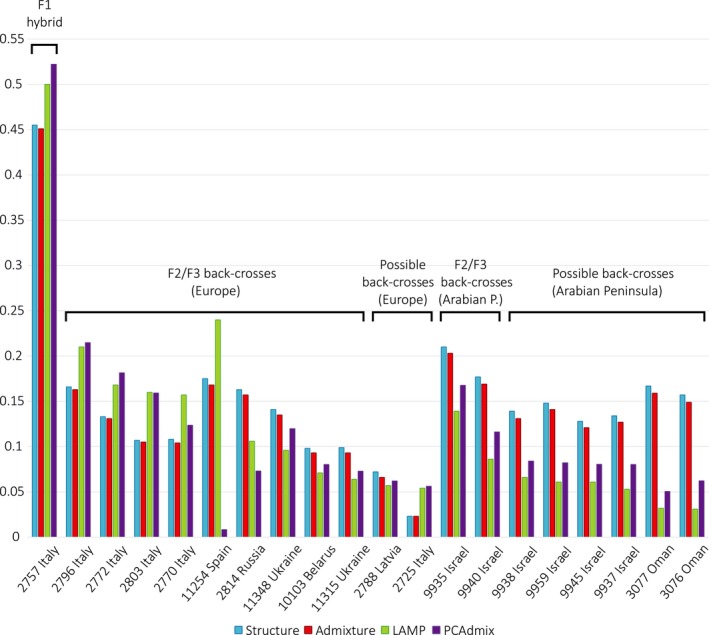
Figure 3.

Dog ancestry proportions in the F1 hybrid, F2/F3 back‐crosses and putative further generation back‐crosses, estimated from the ancestry blocks analyses in lamp and PCA dmix, and the analysis of population genetic structure in structure and admixture. Individuals’ admixture status was inferred based on the results from lamp, structure and admixture, while the PCA dmix was carried out as a follow‐up analysis. The lamp and PCA dmix results are presented as the mean percentage of SNP alleles of dog ancestry in autosomal chromosomes. The structure and admixture results are presented as the assignment probability of an individual to the dog cluster (assuming K = 2). The ancestry proportions were calculated for autosomal chromosome data
