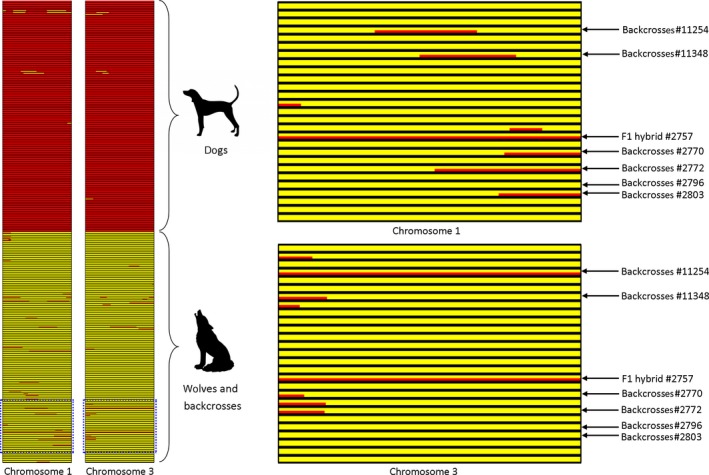
Figure 5.

Results of ancestry block analysis in LAMP for two chromosomes, shown as an example. Dog ancestry is marked in red and wolf ancestry in yellow. Each row represents one individual, with dogs followed by wolves and admixed canids. A part of the graph is enlarged to show individual hybrids and back‐crosses. The ancestry plots for all 38 chromosomes are available in the Figure S3
