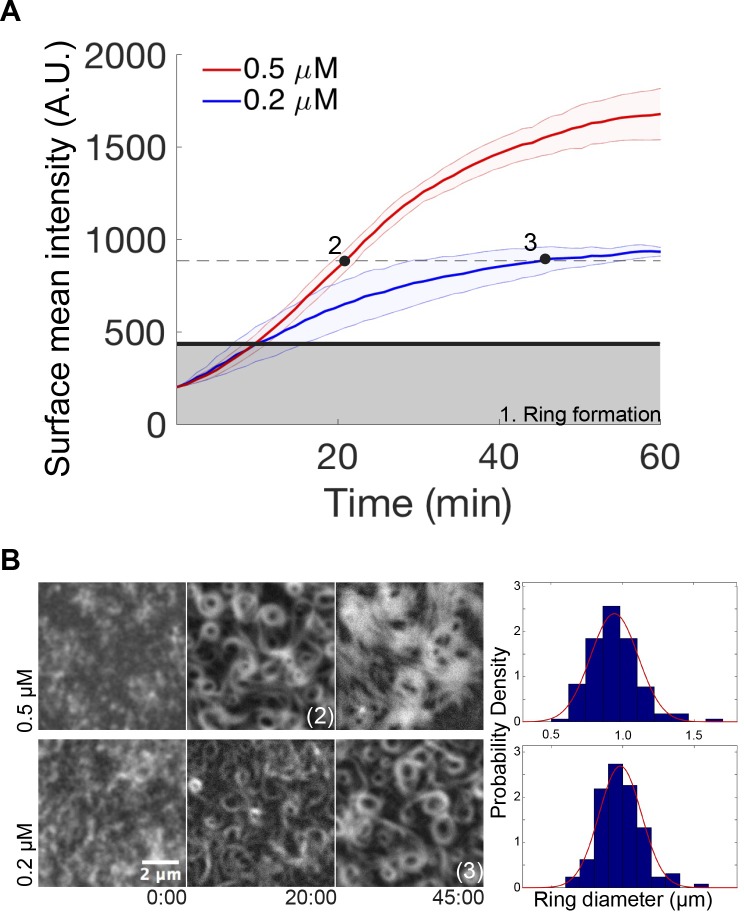
Fig 2. Dependence of FtsZ-YFP-mts vortex formation on protein surface concentration.
(A) Time dependence of the average fluorescence intensity of FtsZ-YFP-mts on the bilayer upon 4 mM GTP and 5 mM Mg2+ addition, as measured by TIRFM, at 0.2 (blue line) and 0.5 (red line) μM protein concentration. The gray area marks the intensity when first closed rings are observed, which is approximately the same for both protein concentrations. After closed rings have formed, the further accumulation of protein at the surface is strongly concentration dependent. The dashed line represents the phase in which clearly discernible, locally stable dynamic vortices are observed. While at 0.2 μM, the system reaches this regime after an elapsed time of 45 min (time point 3); at 0.5 μM, it only takes approximately 20 min (time point 2). (B) Representative images of the experiment shown in panel (A). Frames were taken at elapsed times in minutes. Right: Ring size distributions at time points 2 and 3, indicated in panel (A), with average diameters of 0.94 +/− 0.16 μm, N = 140, and 0.98 +/− 0.14 μm, N = 128, respectively. Size distributions of rings are similar since both correspond to the same protein surface density (approximately 880 A.U.) Further details are under “Results.” A.U., arbitrary units; GTP, guanosine triphosphate; mts, membrane-targeting sequence; TIRFM, total internal reflection fluorescence microscope; YFP, yellow fluorescent protein.

