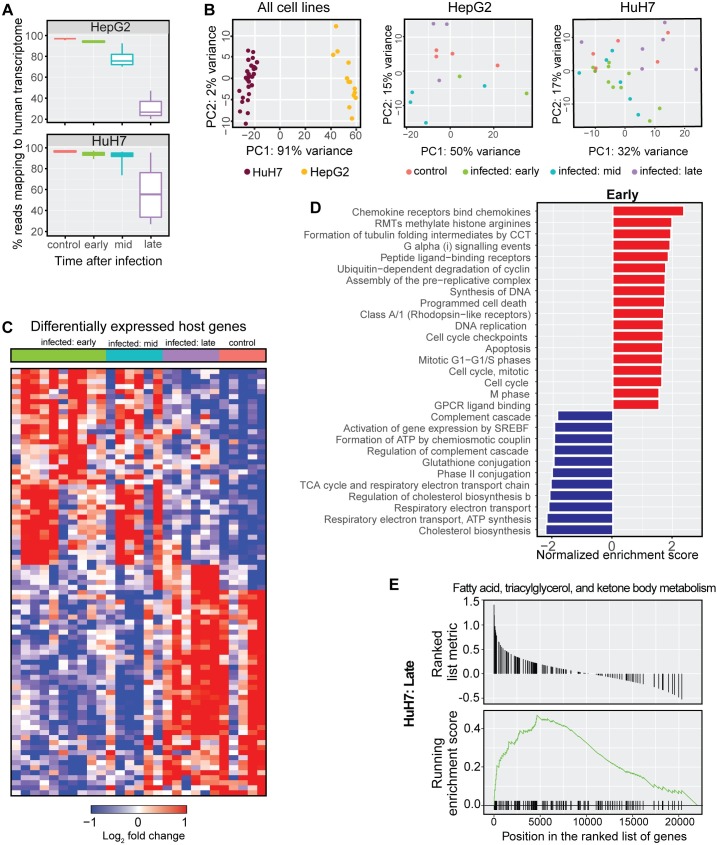
Fig 7. Gene expression patterns associated with P. berghei hepatocyte infection at various times post infection.
(A) Percentage of reads mapping to the human transcriptome decreases with time after infection, with the unmapped reads mapping to P. berghei. (B) Principal component analysis on all samples shows grouping by cell lines accounts for 91% of variability, while PCA on the individual cell lines did not reveal discreet clusters. (C) Heatmap of differentially expressed genes (adjusted p < 0.05) show unique expression profiles of the for early, mid, and late time points after infection. (D) Pathways statistically enriched among up- or down-regulated genes in “early” P. berghei-infected HuH7 hepatocyte as determined by gene set enrichment analysis (GSEA). (E) GSEA plot for a representative gene set (fatty acid, triacylglycerol, and ketone body metabolism) from the “late” P. berghei-infected HuH7 hepatocytes that is statistically enriched (adjusted p < 0.05).

