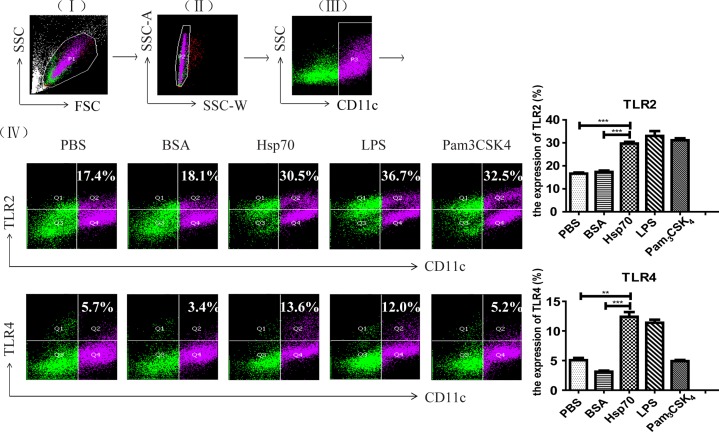
Fig 2. Upregulation of both TLR2 and TLR4 on the surface of mouse bone marrow-derived DCs stimulated by rTs-Hsp70.
Representative dot plots for the gating strategy: (I) gating on viable cells, (II) selection of non-adherent cells, (III) gating on CD11c+ cells, and (IV) selection of TLR2+ cells from gated CD11c+ cells (upper panel) and TLR4+ cells from gated CD11c+ cells (lower panel), respectively. The expression percentage of TLR2/4 on DCs stimulated with rTs-Hsp70 is shown on the right. All experiments were performed three times and data are shown with mean ± SD. n = 3, ** p < 0.01, *** p < 0.001.

