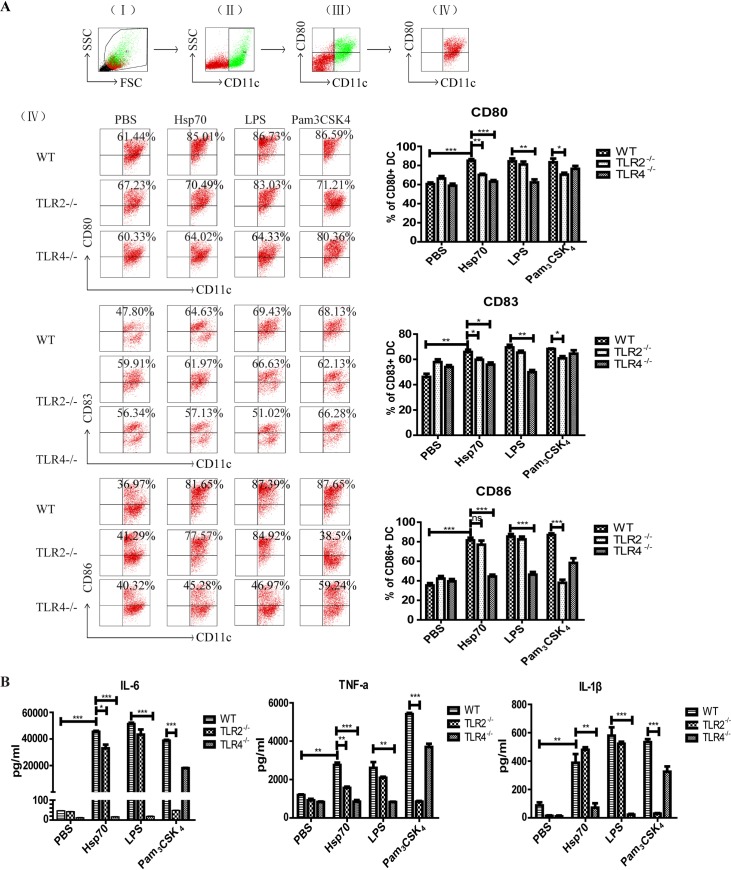
Fig 3. The activation of DCs by rTs-Hsp70 in vitro was inhibited in DCs with TLR2 or TLR4 knockout.
(A) Expression of co-stimulatory molecules on the surface of DCs from WT and TLR2/4-/- mice stimulated by rTs-Hsp70. The DCs from WT, TLR2-/-, TLR4-/- mice were incubated with rTs-Hsp70, LPS, Pam3CSK4 and PBS. Then the co-stimulatory molecules (CD80, CD83, CD86) and CD11c on the surface of DCs were detected by flow cytometry. Representative dot plots for the gating strategy: (I) gating on viable cells, (II) gating on CD11c+ cells, (III) selection of CD80+ and CD11c+ cells from gated R1 cells, and (IV) selection of CD80+ from gated CD11c+ cells, upper right represent percentages of double positive cells. The bar graphs on the right display the mean ± SD of every group from three experiments. (B) The secretion of cytokines by rTs-Hsp70-stimulated DCs from WT or TLR2/4-/- mice measured by ELISA. Quantified data are shown as mean ± SD of three separate experiments. n = 3, * p < 0.05, ** p < 0.01, *** p < 0.001, ns, not significant.

