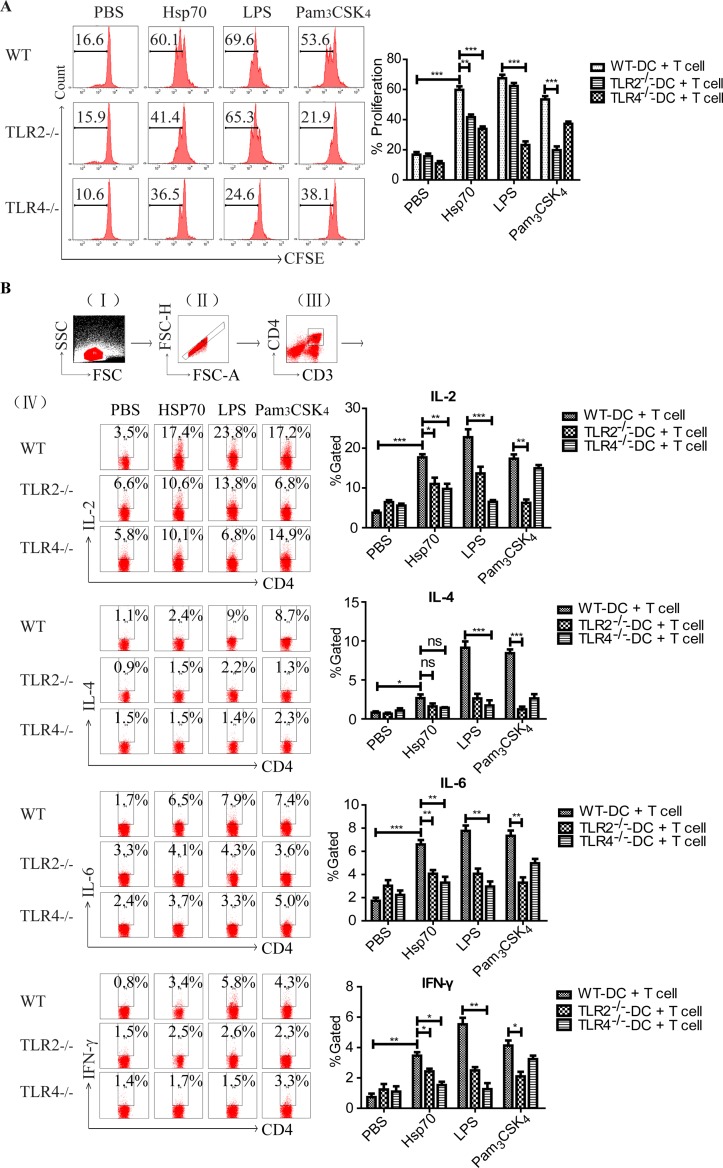
Fig 4. The proliferation and cytokine release of naïve splenocytes stimulated by rTs-Hsp70-activated DCs.
(A) The proliferation of naïve CD4+ T cells stimulated by rTs-Hsp70-activated DCs from WT and TLR2/4-/- mice determined by CFSE. The DCs from WT, TLR2-/- or TLR4-/- mice were pre-incubated with rTs-Hsp70 or other controls including PBS, BSA, LPS and Pam3CSK4, then co-cultured with naïve mouse spleen CD4+ T cells. Representative histograms of the gated CD4+ T cells are shown in the left panel. The % of proliferation is shown as mean ± SD of three separate experiments in the right panel. n = 3, ** p < 0.01, *** p < 0.001. (B) The cytokine profile secreted by T cells stimulated by rTs-Hsp70-activated DCs from WT TLR2/4-/- mice was measured by intracellular cytokine staining. (I) gating on viable cells, (II) selection of non-adherent cells, (III) gating on CD3+ CD4+ T cells, and (IV) selection of IL-2+, IL-4+, IL-6+, IFN-γ+ cells from gated CD4+ T cells, respectively. Quantified data are shown as mean ± SD of three separate experiments. n = 3, * p < 0.05, ** p < 0.01, *** p < 0.001.

