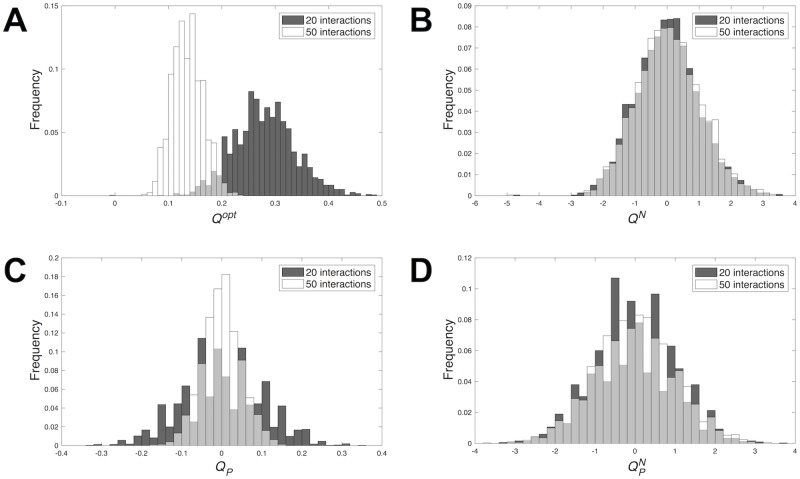
Fig 1. Distribution of modularity in random networks with different number of interactions.
Each panel shows the distribution of a modularity score for sparse (20 interactions) and dense (50 interactions) networks with ten nodes. Each sample contains 3,000 random networks. (A) Distribution of the raw modularity score Qopt. Mean ± SD Qopt equals 0.278 ± 0.057 for sparse and 0.135 ± 0.029 for dense networks. Kolmogorov-Smirnov test: D = 0.922; p < 2.2 × 10⁻¹⁶. (B) Distribution of the normalized modularity score QN. Mean ± SD QN equals 0.008 ± 0.981 for sparse and 0.052 ± 0.991 for dense networks. Kolmogorov-Smirnov test: D = 0.064; p = 0.257. (C) Distribution of the raw modularity score QP for a specific partition P. Mean ± SD QP equals −0.002 ± 0.101 for sparse and 3.7 × 10⁻⁴ ± 0.05 for dense networks. Kolmogorov-Smirnov test: D = 0.22; p = 6.18 × 10⁻¹¹. (D) Distribution of the normalized modularity score for a specific partition P. Mean ± SD equals −0.023 ± 1.02 for sparse and 0.007 ± 0.999 for dense networks. Kolmogorov-Smirnov test: D = 0.062; p = 0.29.

