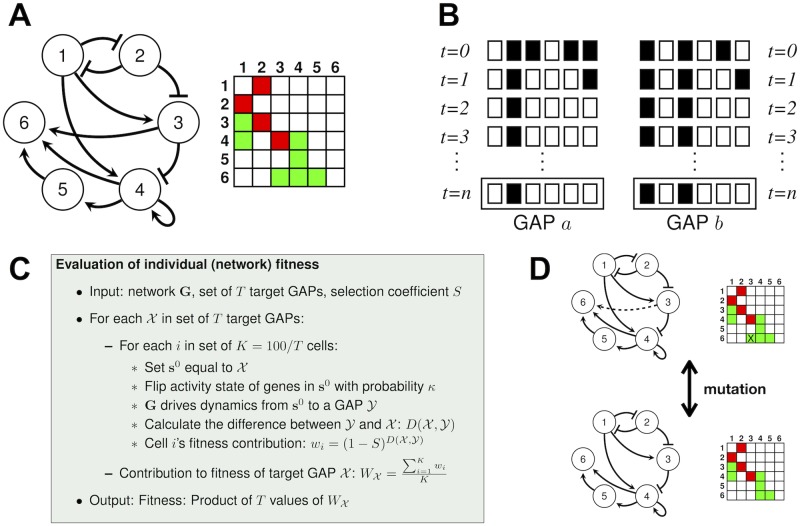
Fig 2. Gene network dynamics, mutation and evaluation of fitness.
(A) A gene network can be described as a graph or as a matrix in which positive entries (green squares) represent activatory interactions (arrows) and negative entries (red squares) represent inhibitory interactions (blunt-end lines). (B) Each row with six squares represent a system state. White and black squares represent active and inactive genes, respectively. An initial pattern of gene activity (at t = 0) is updated according to the interactions described in panel (A) until dynamics lead to a GAP, a sequence of system states that is repeated indefinitely. The gene network in (A) is able to yield two different GAPs when it starts its dynamics from different initial system states. (C) Summary of the procedure to evaluate a network’s fitness in evolutionary simulations. Fitness is higher in networks that produce GAPs, from different initial conditions, similar to target GAPs that selection favours. (D) Mutations in the model change interactions between genes. They thus modify the matrix that specifies whether a gene i regulates a second gene j. The activatory interaction that mutation wrecks is dashed in the top network and its corresponding entry is marked with an X.

