Abstract
Background and study aims
Many studies have shown the utility of rigid three-dimensional (3 D) endoscopes in surgery, but few have reported the utility of flexible 3 D endoscopes. This ex vivo study was intended to investigate whether a newly developed 3 D endoscope (GIF-Y0083; Olympus) improves diagnostic accuracy for superficial gastric tumor.
Methods
Twelve observers comprising experts, trainees, and novices (4 each) evaluated 2 D and 3 D images of 20 specimens resected by gastric ESD. Evaluation items were diagnostic accuracy of tumor extent and degree of confidence in assessing (a) tumor extent, (b) morphology, and (c) comprehensive recognition. The 2 D and 3 D endoscopy data were compared in a crossover analysis.
Results
Overall, diagnostic accuracy was significantly higher with 3 D images (88.1 %) than with 2 D images (84.2 %) ( P < 0.01). Comparison by skill level showed that 3 D images significantly improved diagnostic accuracy among novices but not among experts or trainees. Comparison by morphology showed that diagnostic accuracy did not differ significantly for type IIa/IIb lesions but improved significantly for type IIc lesions among trainees and novices. Overall, 3 D images significantly increased the degree of confidence in the assessment of all three items (a – c). Comparison by skill level showed similar results, and comparison by morphology showed that regardless of skill level, the degree of confidence in assessing all items (a – c) increased significantly only when examining type IIc lesions.
Conclusion
Compared with 2 D images, 3 D images significantly improved both diagnostic accuracy of tumor extent and degree of confidence for diagnosing superficial gastric tumor. The utility of the 3 D endoscope was apparent among trainees and novices and for the diagnosis of type IIc lesions.
Introduction
Conventional endoscopic imaging relies solely on two-dimensional (2 D) information, and therefore lacks depth information. Although the utility of three-dimensional (3 D) endoscopic systems has been reported in many studies showing that these systems improve the speed and accuracy of surgery through the enhancement of depth perception 1 2 3 , there have been few reports on endoscopic diagnosis made by using flexible endoscopes 4 . Against this background, we previously reported that diagnostic accuracy for superficial gastrointestinal tumor was improved by converting 2 D endoscopic images of endoscopic submucosal dissection (ESD) resection specimens into 3 D images 5 . In the current study, using a newly developed prototype 3 D endoscope, we investigated whether the 3 D system improves diagnostic accuracy for superficial gastric tumor compared with 2 D endoscopy.
Methods
Experimental design
Twelve observers comprising experts, trainees, and novices (4 each) participated in this study, which used a crossover design to reduce bias ( Fig. 1 ). An expert was defined as an endoscopist with 10 years of experience in endoscopy, and a novice was defined as a physician who had never performed a single routine endoscopic examination. Experts, trainees, and novices were divided equally into two experimental groups (the 2 D-first group and 3 D-first group), each therefore containing two experts, two trainees, and two novices. In the 2 D-first group, observers evaluated 2 D images and then 3 D images after a 1-week washout period; in the 3D-first group, 3 D images were evaluated before 2 D images, with a 1-week washout period. Evaluation items were (1) diagnostic accuracy of tumor extent and (2) degree of confidence for (a) tumor extent, (b) morphology, and (c) comprehensive recognition. The degree of confidence was scored using a 5-point scale: 1 = extremely likely, 2 = likely, 3 = more likely than not, 4 = unlikely, and 5 = very unlikely. In addition, the coefficient of correlation was analyzed for diagnostic accuracy and degree of confidence.
Fig. 1.

Flow diagram of the study.
Lesions
We examined 20 resection specimens from gastric tumors (15 differentiated adenocarcinomas, 1 undifferentiated adenocarcinoma, and 4 adenomas) obtained by ESD at our hospital. Pathological examination revealed that six, five, and nine lesions were type IIa, IIb, and IIc, respectively. The median tumor size was 11.0 mm (range 5 – 40 mm).
Endoscopic imaging and observation
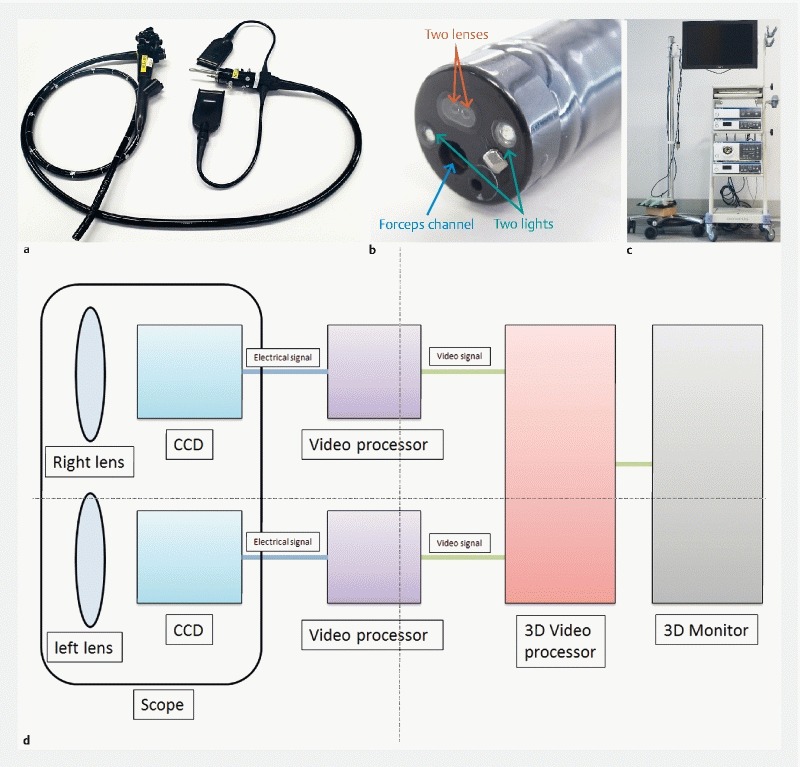
The dimensions of the newly developed 3 D prototype endoscope (GIF-Y0083; Fig. 2 a , Fig. 2 b ) were outer diameter at the tip of the scope, 12.2 mm; maximum diameter of the scope, 14.1 mm; length of the scope, 1030 mm; and the diameter of the channel, 2.8 mm. Although magnification is not feasible, the endoscope is equipped with narrow-band imaging and water jet technologies. This newly developed 3 D prototype endoscope was used along with an endoscopic system identical to that used in surgery: EVIS EXERA III Video System Center, 3 D Visualization Unit (CV-190), and EVIS EXERA III Xenon Light Source (3DV-190), and EVIS EXERA III (CLV-190) (all from Olympus) as well as 3 D Medical Display (LMD-3251MT; Sony) ( Fig. 2 c ). Images are obtained through each lens and sent to each video processer as an electrical signal. Each video processer changes the electrical signal to video signal similar to the working of the conventional endoscope. Each video signal is sent to a 3 D video processer and synthesized as a 3 D image. Finally, the 3 D image is visualized using a 3 D monitor and 3 D glasses ( Fig. 2 d ) 6 . In these systems, 2 D mode can be switched to 3 D mode and vice versa with one button.
Fig. 2 a.

The newly developed 3 D prototype endoscope (Olympus, GIF-Y0083). b Image of the tip of 3 D flexible endoscope. There are 2 lenses at the tip of the endoscope (red arrow). c A 3 D endoscopic system. d The schema of 3 D flexible endoscope.
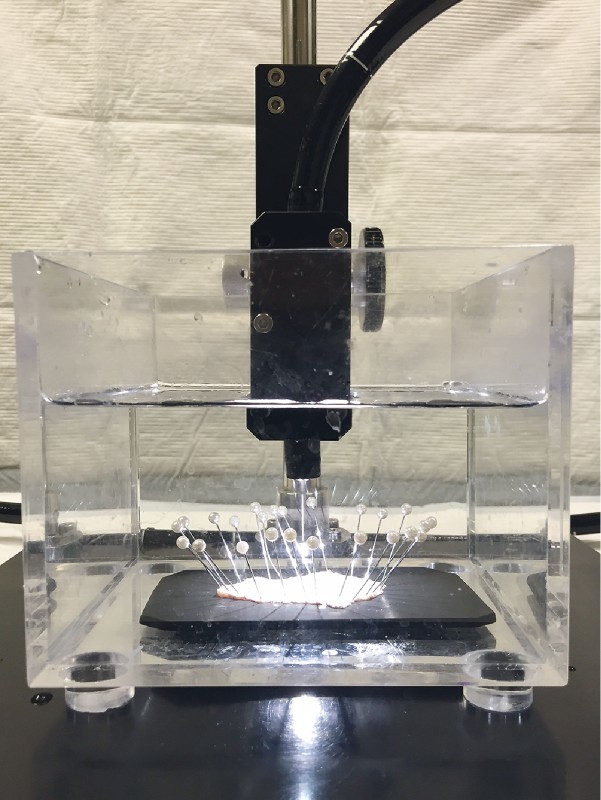
Immediately after ESD, the resected specimen was immobilized with pins on a black rubber plate, and using an endoscope fixture, conventional white light endoscopy or chromoendoscopy was performed without magnification to generate 2 D and 3 D images of the specimen under water ( Fig. 3 ). Because 3 D samples cannot be presented without a 3 D monitor and 3 D glasses, only a 2 D sample is shown in Fig. 4 a .
Fig. 3.

The method of endoscopic imaging.
Fig. 4 a.

A 2 D sample of the resection specimen. b Adenocarcinoma components are detected in red line. c Method used to diagnose tumor extent.
Diagnosis of tumor extent
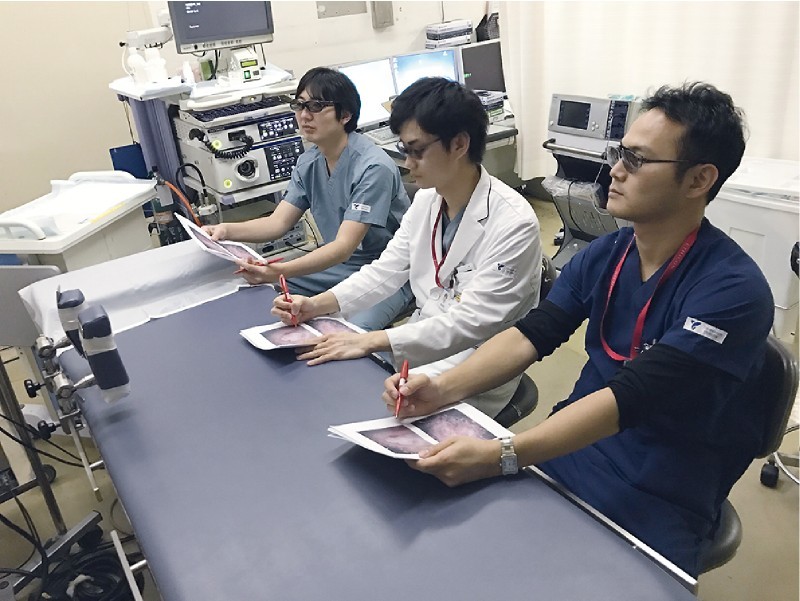
At more than 1 month after ESD, the 12 endoscopists who were blinded to the actual diagnosis and histopathological findings in each case evaluated the diagnostic accuracy of tumor extent in all 20 cases by drawing a demarcation line on printed 2 D images while viewing 2 D and 3 D images of individual lesions. Three-dimensional monitors and 3 D glasses were used to evaluate the 3 D images ( Fig. 5 ). Accuracy was then determined based on histological mapping ( Fig. 4 b ). Diagnostic accuracy was calculated using the following formula: Diagnostic accuracy = Number of accurate diagnoses of lesions and non-lesion areas/(Number of lines passing through non-lesion areas + Number of starting and ending points of line segments within the lesion). To explain with a specific example, Fig. 4 b shows eight starting and ending points of line segments within the lesion and four white solid lines in the non-lesion area, giving a sum of 12 (8 + 4), which is used as the denominator when calculating the diagnostic accuracy. In Fig. 4 c , the total number of accurate diagnoses of lesion and non-lesion areas is nine (blue circles) with respect to the sample demarcation line (yellow), making the diagnostic accuracy 75 % (9/12). Marking with error ≥ 1 mm was judged to be inaccurate.
Fig. 5.

A scene of 3 D evaluation.
Statistical analysis
Data are presented as the mean ± standard deviation. Accuracy and degree of confidence (5-point scale score) were compared between 2 D and 3 D approaches by paired t -test and Wilcoxon signed-rank test, respectively. All statistical analyses were performed using Stata version 14 (StataCorp LLC., College Station, Texas, United States) and a P value < 0.05 was considered to be statistically significant.
Results
Accuracy of assessing tumor extent
Overall, diagnostic accuracy was significantly higher with 3 D images (88.1 %) than with 2 D images (84.2 %) ( Table 1 ). Results were similar between the 2D-first and 3D-first groups, suggesting that the results were not affected by bias ( Table 1 ). Comparison by skill level showed that 3 D images improved diagnostic accuracy regardless of skill level. In particular, there was a significant difference among novices ( Table 2 ). Comparison by morphology showed that diagnostic accuracy for type IIa and IIb lesions with 3 D images was better than or equal to that with 2 D images, even though no statistically significant difference was attained. In contrast, diagnostic accuracy for type IIc lesions improved significantly among trainees and novices ( Table 2 ).
Table 1. Accuracy in determining extent of disease.
| 2 D | 3 D | P | |
| Overall (95 % CI) | 84.2 % (80.8 – 87.5) | 88.1 % (85.2 – 91.0) | < 0.01 |
| 2 D-first group (95 % CI) | 84.3 % (79.7 – 89.0) | 87.0 % (82.8 – 91.1) | < 0.05 |
| 3 D-first group (95 % CI) | 85.1 % (80.8 – 89.5) | 89.2 % (85.1 – 93.3) | < 0.01 |
Table 2. Comparison by skill level of diagnostic accuracy in assessing extent of disease.
| Expert | Trainee | Novice | |||||||
| 2 D | 3 D | P | 2 D | 3 D | P | 2 D | 3 D | P | |
| Overall (95 % CI) | 93.5 % (90.5 – 96.5) | 95.3 % (92.8 – 97.7) | 0.293 | 85.7 % (80.2 – 91.2) | 89.5 % (84.4 – 94.7) | 0.172 | 73.2 % (66.1 – 80.3) | 79.4 % (73.3 – 85.6) | < 0.05 |
| IIa (95 % CI) | 100 % | 100 % | 97.2 % (91.9 – 100) | 92.6 % (82.7 – 100) | 0.196 | 94.4 % (87.8 – 100) | 91.3 % (82.0 – 100) | 0.506 | |
| IIb (95 % CI) | 89.8 % (82.2 – 97.4) | 95.4 % (90.7 – 100) | 0.232 | 73.8 % (59.7 – 88.0) | 80.1 % (67.2 – 92.9) | 0.419 | 61.3 % (47.8 – 74.8) | 63.0 % (49.9 – 76.1) | 0.322 |
| IIc (95 % CI) | 91.3 % (86.6 – 95.9) | 92.1 % (87.6 – 96.5) | 0.768 | 84.7 % (77.5 – 91.9) | 92.7 % (87.2 – 98.3) | < 0.05 | 65.8 % (54.4 – 77.1) | 80.6 % (72.3 – 88.9) | < 0.01 |
Degree of confidence
Comparison by skill level showed that 3 D images increased levels of confidence in assessing the items (a – c) overall and regardless of skill level ( Table 3 ). Comparison by morphology showed that degree of confidence increased significantly among experts and trainees when assessing morphology and comprehensive recognition of type IIa lesions. A significant increase was also observed for assessing morphology of type IIb lesions regardless of skill level and comprehensive recognition of type IIb lesions among experts. As for type IIc lesions, 3 D images significantly increased levels of confidence in assessing all items ( Table 4 ).
Table 3. Degree of certainty.
| (a) Extent of disease | (b) Surface asperity | (c) Comprehensive recognition | |||||||
| 2 D | 3 D | P | 2 D | 3 D | P | 2 D | 3 D | P | |
| Overall | 2.82 ± 1.09 | 3.20 ± 1.04 | < 0.01 | 2.65 ± 1.00 | 3.43 ± 0.99 | < 0.01 | 2.66 ± 1.03 | 3.12 ± 1.06 | < 0.01 |
| Expert | 3.00 ± 0.92 | 3.34 ± 0.88 | < 0.01 | 3.04 ± 0.83 | 3.66 ± 0.84 | < 0.01 | 2.88 ± 0.98 | 3.36 ± 0.90 | < 0.01 |
| Trainee | 2.91 ± 1.13 | 3.41 ± 1.18 | < 0.01 | 2.46 ± 0.93 | 3.55 ± 1.09 | < 0.01 | 2.69 ± 1.07 | 3.24 ± 1.22 | < 0.01 |
| Novice | 2.55 ± 1.14 | 2.85 ± 0.95 | < 0.01 | 2.45 ± 1.11 | 3.06 ± 0.91 | < 0.01 | 2.43 ± 1.00 | 2.76 ± 0.93 | < 0.01 |
Table 4. Comparison by skill level or morphology of degree of confidence.
| (a) Extent of disease | (b) Surface asperity | (c) Comprehensive recognition | ||||||||
| 2 D | 3 D | P | 2 D | 3 D | P | 2 D | 3 D | P | ||
| IIa | Expert | 3.88 (3.28 – 4.47) | 4.13 (3.40 – 4.85) | 0.21 | 3.71 (2.97 – 4.44) | 4.25 (3.53 – 4.97) | < 0.01 | 3.79 (2.98 – 4.61) | 4.13 (3.34 – 4.91) | < 0.05 |
| Trainee | 3.63 (2.51 – 4.74) | 4.08 (3.05 – 5.12) | 0.13 | 3.13 (2.15 – 4.10) | 4.33 (3.65 – 5.02) | < 0.01 | 3.50 (2.42 – 4.58) | 4.04 (3.06 – 5.02) | < 0.05 | |
| Novice | 3.54 (2.59 – 4.50) | 3.54 (2.73 – 4.36) | 0.91 | 3.33 (2.39 – 4.28) | 3.71 (2.97 – 4.44) | 0.17 | 3.25 (2.42 – 4.08) | 3.42 (2.85 – 3.99) | 0.65 | |
| IIb | Expert | 2.50 (1.91 – 3.09) | 2.90 (2.13 – 3.67) | 0.06 | 2.70 (2.14 – 3.26) | 3.25 (2.55 – 3.95) | < 0.05 | 2.50 (1.91 – 3.10) | 2.95 (2.09 – 3.82) | < 0.05 |
| Trainee | 2.65 (1.74 – 3.56) | 2.75 (1.86 – 3.64) | 0.78 | 2.20 (1.60 – 2.80) | 2.90 (2.01 – 3.79) | < 0.05 | 2.35 (1.62 – 3.08) | 2.55 (1.69 – 3.42) | 0.47 | |
| Novice | 2.00 (1.05 – 2.94) | 2.45 (1.65 – 3.26) | 0.13 | 2.15 (1.14 – 3.16) | 2.75 (1.98 – 3.52) | < 0.01 | 2.10 (1.16 – 3.04) | 2.50 (1.63 – 3.34) | 0.16 | |
| IIc | Expert | 2.69 (1.85 – 3.54) | 3.06 (2.39 – 3.72) | < 0.05 | 2.78 (2.03 – 3.53) | 3.50 (2.74 – 4.26) | < 0.01 | 2.47 (1.64 – 3.30) | 3.08 (2.44 – 3.72) | < 0.01 |
| Trainee | 2.58 (1.55 – 3.62) | 3.33 (2.15 – 4.51) | < 0.01 | 2.16 (1.33 – 3.00) | 3.39 (2.28 – 4.50) | < 0.01 | 2.33 (1.42 – 3.25) | 3.08 (1.85 – 4.32) | < 0.01 | |
| Novice | 2.19 (1.29 – 3.10) | 2.61 (1.75 – 3.47) | < 0.01 | 2.02 (1.13 – 2.92) | 2.81 (1.93 – 3.68) | < 0.01 | 2.06 (1.28 – 2.84) | 2.47 (1.54 – 3.40) | < 0.05 | |
Correlation coefficient
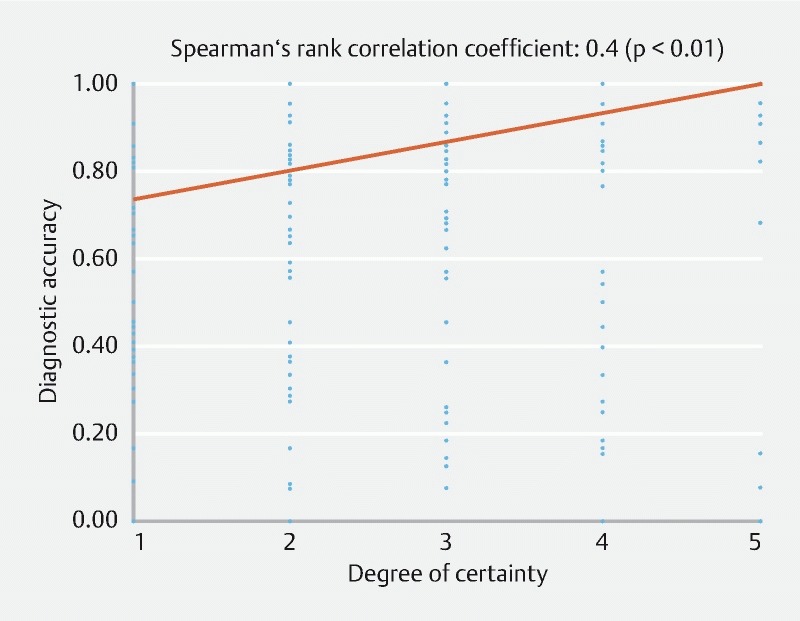
A scatterplot and fitted curve are shown in Fig. 6 . Diagnostic accuracy and confidence had a correlation coefficient of 0.4, showing a correlation between the two factors.
Fig. 6.

Scatter diagram.
Discussion
The brain has the stereoscopic ability to convert flat 2 D images, such as those on a television screen, into 3 D images. To perceive depth of view or the dimension of objects, the brain converts the parallax that exists between visual information entering from the two eyes into 3 D information. With use of special glasses, modern 3 D technology allows the addition of depth to 2 D images taken with twin lenses and displayed on a 2 D monitor. Three-dimensional technology has been applied in various fields including cinematography. In recent years, the application range of 3 D technology has steadily expanded into the medical field. In conventional laparoscopic surgery, which relies on only 2 D information displayed on the monitor, lack of depth information makes it difficult to determine the location of organs and depth of the surgical field. Because 3 D endoscopy can compensate for this type of drawback, many studies have reported the utility and/or safety of a 3 D endoscopic system 7 8 9 10 11 12 . Despite heightened expectations for the utility of endoscopic diagnosis through the addition of 3 D information, no study has been performed of endoscopic diagnosis using a flexible 3 D endoscope. In this study, we therefore used 3 D images generated by the newly developed 3 D endoscope and evaluated the utility of 3 D endoscopy in diagnosis of superficial gastric tumor. This is the first report of endoscopic diagnosis made by using flexible 3 D endoscopes.
In this study, diagnostic accuracy for tumor extent was significantly improved by use of 3 D images compared with 2 D images, especially among novices. In addition, comparison by morphology showed that the utility of 3 D endoscopy was high when examining type IIc lesions. This may reflect the fact that demarcation lines are relatively clear in type IIa lesions and that type IIb lesions seldom benefit from 3 D endoscopy. Furthermore, compared with 2 D images, 3 D images significantly increased levels of confidence in assessing tumor extent, morphology, and comprehensive recognition overall and regardless of skill level. Again, the utility of 3 D endoscopy was high when examining type IIc lesions.
As in the previous study 5 , the findings from this study showed that the utility of 3 D endoscopy is superior among physicians with less experience in endoscopy. This suggests that experts convert 2 D images into stereoscopic structures based on their experience, showing that stronger effects can be expected among novices and trainees. Based on these findings, it is expected that use of 3 D endoscopic images can shorten t training and education among novices and trainees. In addition, 3 D endoscopy increased the degree of confidence significantly even among experts.
One of the problems associated with 3 D endoscopy is eyestrain and headache in individuals who wear 3 D glasses, presumably because the brain is confused by the input of different visual information through the glasses. Similarly, some observers developed eyestrain in this study, necessitating the investigation and establishment of measures against eyestrain in the future.
There is a limitation to this study. Because of the small number of subjects (12 observers) and sample size (20 lesions), this study might not have had a sufficient statistical power. In addition, because ESD specimens were used, diagnosis was performed based only on frontal views. Moreover, because all the specimens were from tumors, further study is needed to perform differential diagnosis of tumors and non-tumors.
In the future, we plan to investigate the efficacy of the 3 D prototype endoscope in diagnosis and treatment of gastrointestinal lesions.
Conclusions
Use of the newly developed 3 D prototype endoscope significantly improved diagnostic accuracy of tumor extent as well as degree of confidence compared with 2 D endoscopy. The utility of 3 D endoscopy was apparent among trainees and novices (physicians with less experience) and when making a morphologic diagnosis of type IIc lesions.
Footnotes
Competing interests None
References
- 1.Sorensen S M, Savran M M, Konge L et al. Three-dimensional versus two-dimensional vision in laparoscopy: a systematic review. Surg Endosc. 2016;30:11–23. doi: 10.1007/s00464-015-4189-7. [DOI] [PubMed] [Google Scholar]
- 2.Feng C, Rozenblit J W, Hamilton A J et al. A computerized assessment to compare the impact of standard, stereoscopic, and high-definition laparoscopic monitor displays on surgical technique. Surg Endosc. 2010;24:2743–2748. doi: 10.1007/s00464-010-1038-6. [DOI] [PubMed] [Google Scholar]
- 3.Tanagho Y S, Andriole G L, Paradis A G et al. 2 D versus 3D visualization: impact on laparoscopic proficiency using the fundamentals of laparoscopic surgery skill set. J Laparoendosc Adv Surg Tech A. 2012;22:865–870. doi: 10.1089/lap.2012.0220. [DOI] [PubMed] [Google Scholar]
- 4.Yao K, Matsui T, Furukawa H et al. A new stereoscopic endoscopy system: accurate 3-dimensional measurement in vitro and in vivo with distortion-correction function. Gastrointest Endosc. 2002;55:412–420. doi: 10.1067/mge.2002.121598. [DOI] [PubMed] [Google Scholar]
- 5.Nomura K, Kaise M, Kikuchi D et al. Recognition Accuracy Using 3D Endoscopic Images for Superficial Gastrointestinal Cancer: A Crossover Study. Gastroenterol Res Pract. 2016:4.561468E6. doi: 10.1155/2016/4561468. [DOI] [PMC free article] [PubMed] [Google Scholar]
- 6.Kikuchi D, Kaise M, Nomura K et al. Feasibility Study of the Three-Dimensional Flexible Endoscope in Endoscopic Submucosal Dissection: An ex vivo Animal Study. Digestion. 2017;95:237–241. doi: 10.1159/000468924. [DOI] [PubMed] [Google Scholar]
- 7.Wagner O J, Hagen M, Kurmann A et al. Three-dimensional vision enhances task performance independently of the surgical method. Surg Endosc. 2012;26:2961–2968. doi: 10.1007/s00464-012-2295-3. [DOI] [PubMed] [Google Scholar]
- 8.Feng X, Morandi A, Boehne M et al. 3-dimensional (3 D) laparoscopy improves operating time in small spaces without impact on hemodynamics and psychomental stress parameters of the surgeon. Surg Endosc. 2015;29:1231–1239. doi: 10.1007/s00464-015-4083-3. [DOI] [PubMed] [Google Scholar]
- 9.Alaraimi B, Bakbak W, Sarker S et al. A randomized prospective study comparing acquisition of laparoscopic skills in three-dimensional (3D) vs two-dimensional (2D) laparoscopy. World J Surg. 2014;38:2746–2752. doi: 10.1007/s00268-014-2674-0. [DOI] [PubMed] [Google Scholar]
- 10.Usta T A, Ozkaynak A, Kovalak E et al. An assessment of the new generation three-dimensional high definition laparoscopic vision system on surgical skills: a randomized prospective study. Surg Endosc. 2015;29:2305–2313. doi: 10.1007/s00464-014-3949-0. [DOI] [PubMed] [Google Scholar]
- 11.Hanna G B, Shimi S M, Cuschieri A et al. Randomised study of influence of two-dimensional versus three-dimensional imaging on performance of laparoscopic cholecystectomy. Lancet. 1998;351:248–251. doi: 10.1016/S0140-6736(97)08005-7. [DOI] [PubMed] [Google Scholar]
- 12.Mueller M D, Camartin C, Dreher E et al. Three-dimensional laparoscopy. Gadget or progress? A randomized trial on the efficacy of three-dimensional laparoscopy. Surg Endosc. 1999;13:469–472. doi: 10.1007/s004649901014. [DOI] [PubMed] [Google Scholar]


