
Fig. 3.
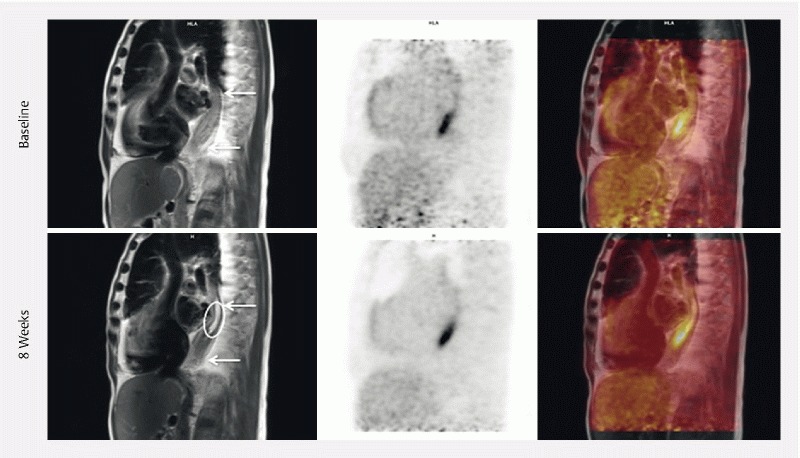
Imaging treatment response. 18F-FDG PET/MRI from patient number 5. From left to right: MRI; 18F-FDG PET; 18F-FDG PET/MRI; MIP*-PET. The arrows show the tumor area; the circle shows the treated area at 8 weeks. Due to stenosis, the distal part could not be treated. In the treated area there is no sign of residual tumor and treatment sequelae is seen as fibrosis. There is no significant change in 18F-FDG activity (SUVmax at baseline 7,59, SUVmax at 8 weeks 7,06). *Maximun intensity projection