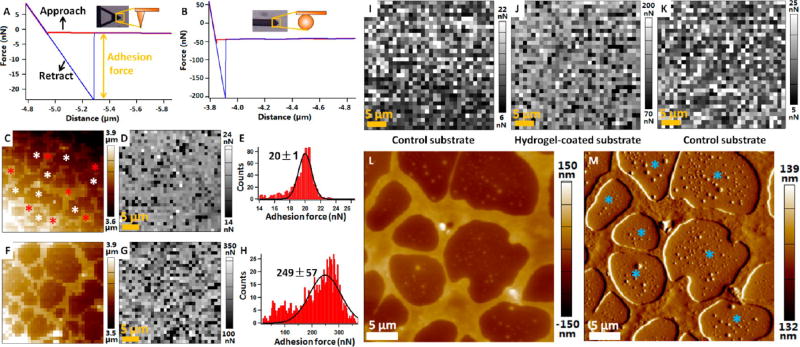
Figure 2.
Quantification of the adhesion characteristics of the fabricated Sundew-inspired hydrogels by AFM force spectroscopy. (A,B) Representative force curves recorded on the hydrogel-coated glass substrate with conical tip (A) and spherical tip (B). The red curve corresponds to the approach process, and the blue curve corresponds to the retract process. Adhesion force is calculated from the retract curve and is equal to the magnitude of the peak. The insets are the optical images and schematic diagrams of tips. (C,D) Topography image (C) and adhesion force map (D) recorded at the force volume mode by conical tip. During force volume mode, 32 × 32 force curves were obtained in 35 × 35 µm2 areas of the hydrogel-coated glass substrate. The red asterisks indicate network porous scaffold area, and the white asterisks indicate the blank area. (E) Histogram and Gaussian fitting of the adhesion forces in (D). (F,G) Topography image (F) and adhesion force (G) recorded on 35 × 35 µm2 areas of the hydrogel-coated glass substrate by spherical tip. (H) Histogram and Gaussian fitting of the adhesion forces in (G). (I–K) Adhesion forces measured on control substrate (without hydrogel) and hydrogel-coated substrate by spherical tip. Adhesion measurements were performed on control substrate first (I), and then adhesion measurements were performed on hydrogel-coated substrate (J) with the same AFM tip. Finally, the same AFM tip was used to measure the adhesion force on control substrate again (K). (L,M) AFM height image (L) and deflection image (M) of the hydrogel-coated substrate. The blue asterisks indicate nanoparticles in the blank area of the hydrogel.

