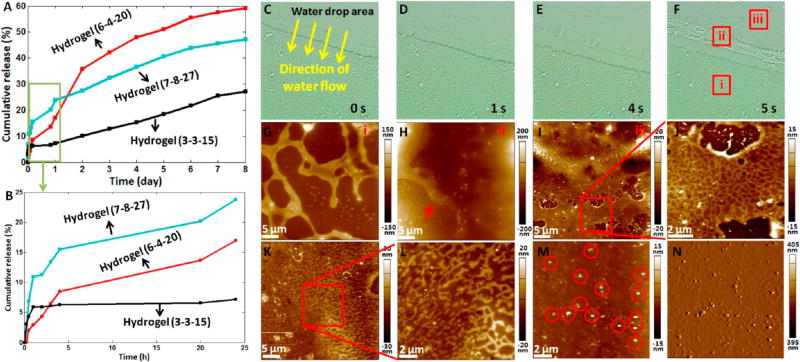
Figure 6.
In vitro drug release and hydrogel degradation. (A,B) In vitro release of MG53 in three types of hydrogels. (A) Release in 8 days. (B) Release in 24 h. (C–N) Morphological changes of the hydrogel (6-4-20) during degradation in vitro. (C–F) Successive optical bright field images of the hydrogel coated on a coverslip after pipetting a drop of pure water on the hydrogel. (G–I) AFM height images of the different areas of the hydrogel (denoted by the squares in (F)). (G) corresponds to the square i. (H) corresponds to the square ii. The arrow in (H) indicates the melting of scaffold. (I) corresponds to the square iii. (J) Higher resolution AFM height image (the scan area is denoted by the square in (I)). (K,L) AFM height images of the degraded hydrogel washed by the second drop of water. (M,N) AFM height image (M) and AFM deflection image (N) of the degraded hydrogel washed by the third drop of water. The circles in (M) indicate the nanoparticles.

