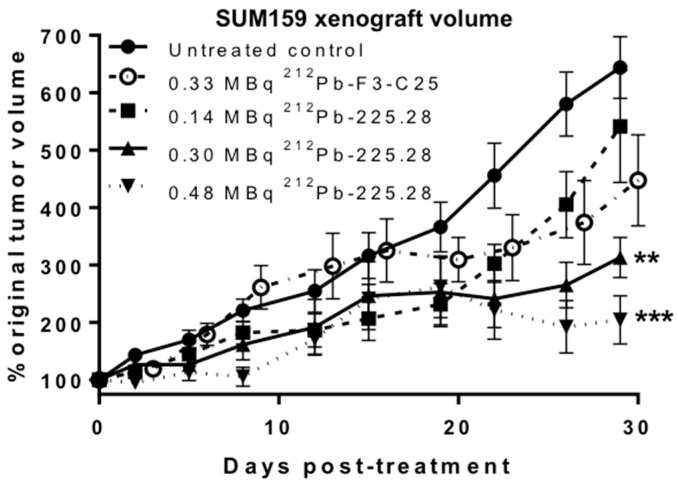
Figure 4.
In vivo tumor growth curves showing the effects of 212Pb-225.28 or 212Pb-F3-C25 on human TNBC xenograft growth inhibition. Groups of mice (n = 10/group) bearing small SUM159 tumors either were left untreated (filled circles) or injected i.v. with 0.33 MBq 212Pb-F3-C25 (open circles) or with 0.14 MBq (filled squares), 0.30 MBq (upward triangles), or 0.48 MBq (downward triangles) 212Pb-225.28. Data were plotted as mean percent change (±standard error of the mean) in normalized tumor volume over time relative to the initial volume at the time of injection with the RIC, and analyzed by one-way ANOVA with Bonferroni’s comparison. ** p < 0.01 or *** p < 0.001 vs. 212Pb-F3-C25 at day 29 after dosing.

