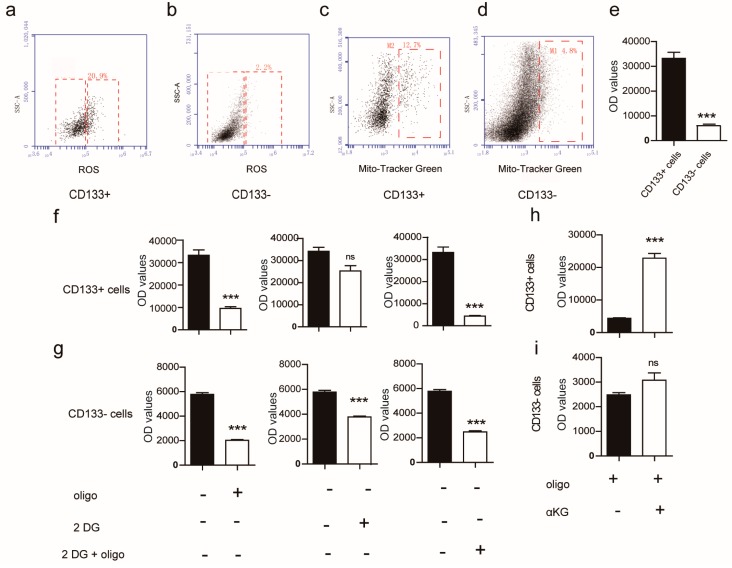
Figure 2.
The analyses of mitochondria function in CD133+/CD133− cells. (a,b) dot plot of reactive oxygen species (ROS) expression in CD133+/CD133− cells was measured by flow cytometry; (c,d) the quantity of mitochondria in CD133+/CD133− cells was detected by a Mito-tracker green staining kit in accordance with the manufacturer’s instructions; (e) the relative ATP level in CD133+ and CD133− cells was tested by a ATP detection kit; (f,g) the CD133+/CD133− cells were respectively treated with 2-DG (2 mM) or oligomycin (0.1 µg/mL), (h,i) and with αKG (8 mM) as indicated; the ATP level was tested by an ATP detection kit following the manufacturer’s instructions. Results are shown as means + SEM and represent three independent experiments. “+” indicates positive cells and ”−“indicates negative cells. *** p < 0.001 versus CD133+ cells; ns, no significant difference.

