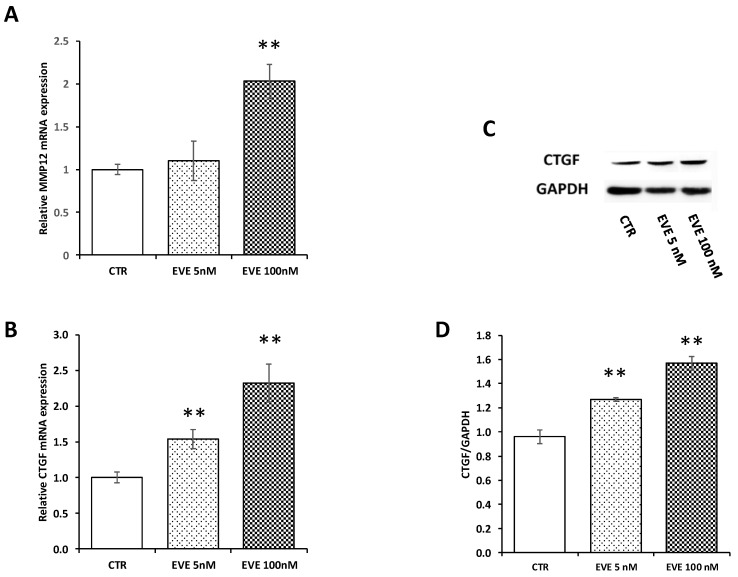
Figure 3.
Gene expression of MMP12 and connective tissue growth factor (CTGF). mRNA level of (A) MMP12 and (B) CTGF evaluated by real-time PCR in BE63/3 cells treated or not with EVE (5 and 100 nM). Data were normalized to GAPDH expression. Mean ± SD (error bars) of two separate experiments performed in triplicate. ** p < 0.001, * p < 0.05 vs. CTR. (C) Representative western blotting experiments for CTGF. (D) Histogram represents the mean ± SD of CTGF protein level. GAPDH was included as loading control. ** p < 0.001 vs. CTR.

