Figure 5.
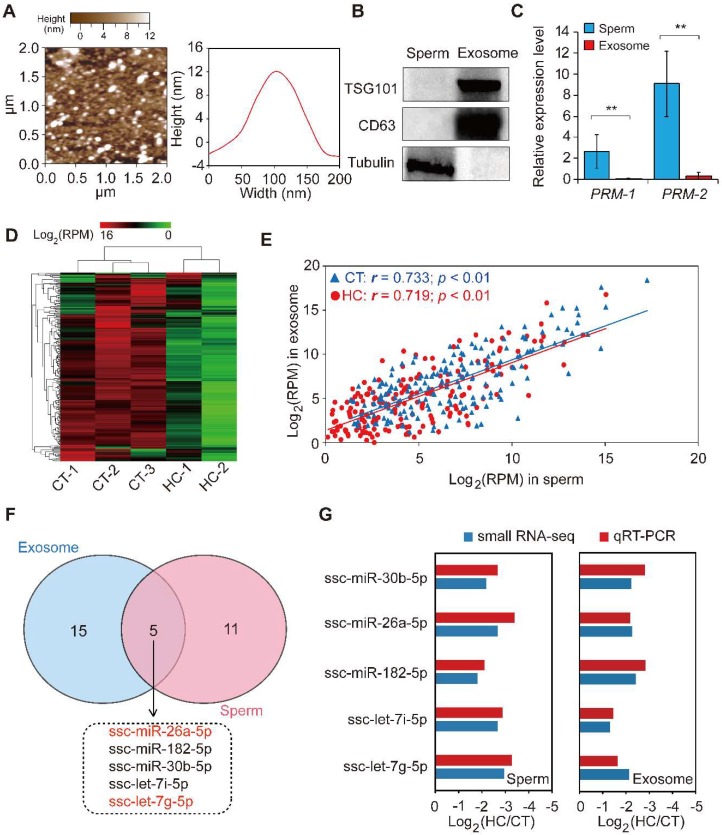
The comparison of miRNA data of sperm and seminal plasma exosomes. (A) Particle size distribution of CT-1 seminal plasma exosomes detected using atomic force microscopy. (B) Western blot analysis showing the enrichment of CD63 and CD81 and the absence of tubulin in CT-1 seminal plasma exosomes compared with sperm cell lysates. (C) The expression pattern of a sperm-specific marker, PRM-1/2, in sperm and seminal plasma exosomes. (D) Hierarchical clustering analysis for the expression of known exosomal miRNAs between control and hemicastrated pigs based on the Euclidean distance. (E) Spearman’s correlation of miRNA expression profiles between sperm and corresponding seminal plasma exosomes. (F) Venn diagram of DE miRNAs between sperm and seminal plasma exosomes in the HC versus CT group. (G) qRT-PCR validation of expression changes of five overlapping DE miRNAs between HC and CT groups. Three independent qRT-PCR experiments were performed in triplicate. All data are expressed as means ± SD. ** p < 0.01.

