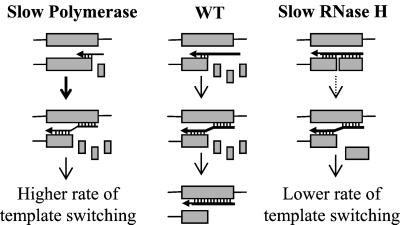
Figure 1.
Dynamic copy-choice model for RT template switching. Shaded boxes represent direct repeats in an RNA template. Horizontal arrows represent nascent DNA. The thickness of these arrows indicates relative polymerization rate: the thicker the arrow, the faster the polymerization rate. Small boxes represent degraded RNA by the RNase H domain. In the case of slow RNase H activity, the degraded RNA fragments are shown as larger boxes. Hydrogen bonds between the RNA template and nascent DNA are designated by vertical marks. Vertical arrows of various thicknesses indicate the relative efficiency of template switching.

