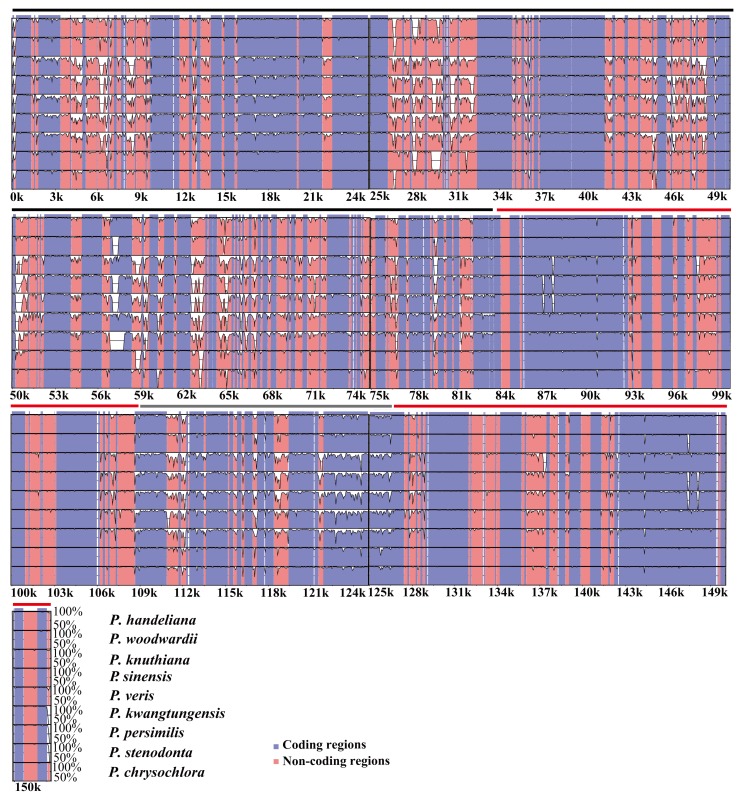
Figure 4.
Sequence identity plot of the 10 Primula plastid genomes, with Primula poissonii as a reference. The y-axis represents % identity ranging from 50% to 100%. Coding and non-coding regions are marked in purple and pink, respectively. The red, black, and gray lines show the IRs, LSC, and SSC regions, respectively.

