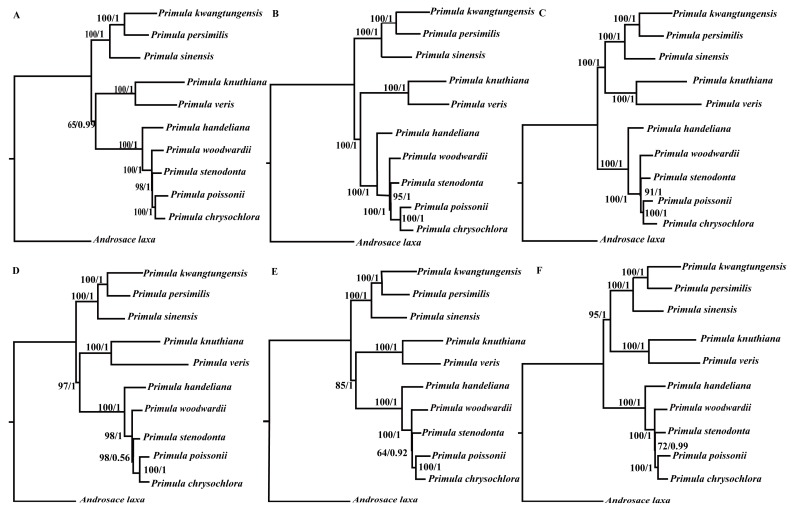
Figure 6.
Phylogenetic relationships of the 10 Primula species and A. laxa inferred from ML and BI analyses. (A) Whole plastid genomes; (B) protein-coding regions; (C) introns and intergenic spacer regions; (D) IR regions; (E) SSC regions; and (F) LSC regions. The numbers near each node are bootstrap support values and posterior probability.

