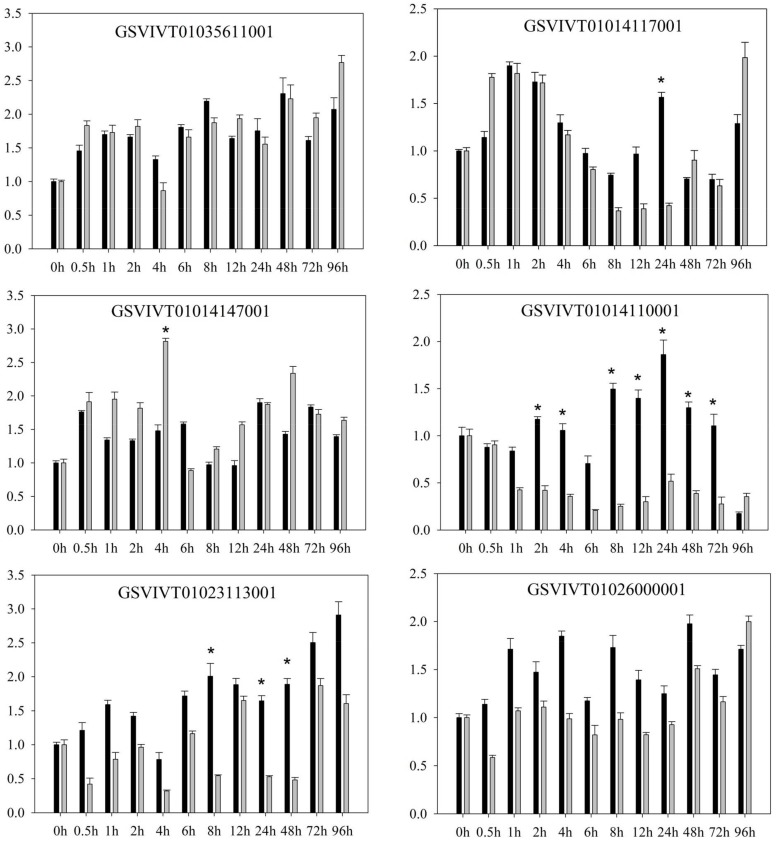
Figure 1.
Relative expression of the pattern recognition receptors (PRR) genes of Vitis amurensis “Shuanghong” after inoculation with Plasmopara viticola “ZJ-1-1” (black bars) and P. viticola “JL-7-2” (gray bars). The values on the vertical axes indicate the fold-changes in gene expression normalized to the expression level of Vitis elongation factor 1-α (EF1-α), SAND, and ubiquitin-conjugating enzyme (UBQ). The x-axes represent the time since inoculation. The error bars represent the standard deviation calculated from three replicates. * indicates significant differences (p < 0.05) as determined with Student’s t-test. Significant differences were identified by comparing the two gene expression levels at each time point.

