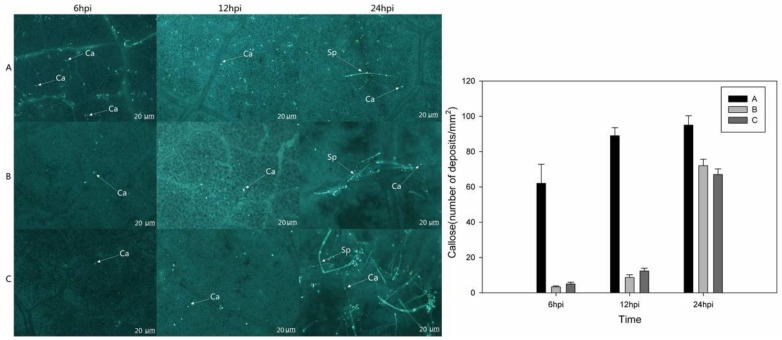
Figure 10.
Microscopic assessment and statistics of callose deposition in the leaves of Vitis vinifera after inoculation with Plasmopara viticola. (A) V. vinifera expressing VaHAESA; (B) V. vinifera transformed with the empty vector (pBI121); (C) untransformed V. vinifera ‘Thompson Seedless’. Representative images were taken 6, 12, 24, and 48 h post-infection (hpi). Ca: Callose, Sp: sporophore.

