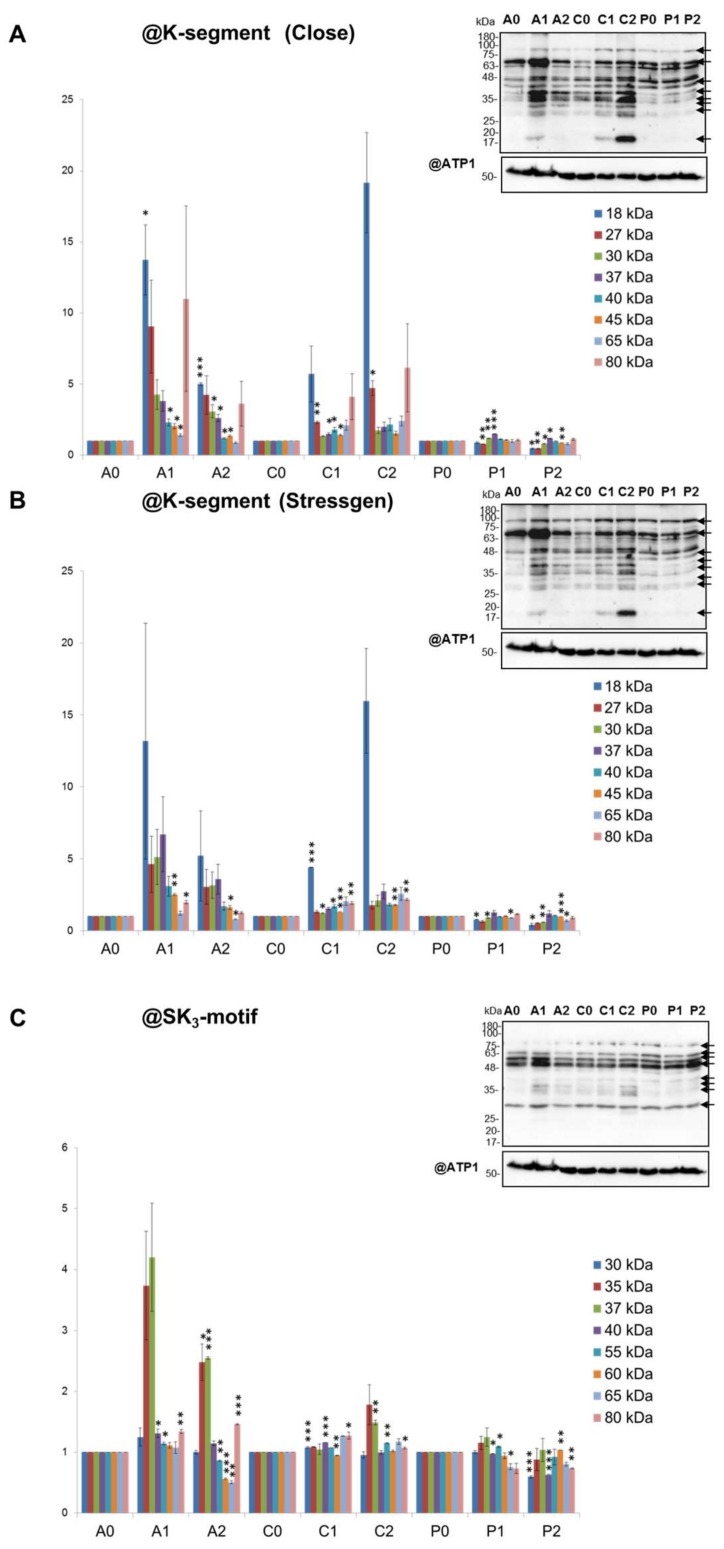
Figure 5.
(pp. 11 and 12) Dlps abundance in mitochondria from control grown “Adelanto”, “Casper” and “Pionier” plants (A0, C0, P1), plants grown in moderate (A1, C1, P1) and severe water deficiency (A2, C2, P2, respectively). Results of analysis of dlps of various size (in kDa) on representative SDS-polyacrylamide gel blots with antibodies directed against (A) dehydrin K-segment from Close [51] (@K-segment (Close)) or from (B) Stressgen (@K-segment (Stressgen)), or (C) antibodies recognizing dehydrin SK3 motif (@SK3) are shown. For loading control, antibody against mitochondrial ATP synthase subunit α (@ATP1) is used. For molecular mass calibration, PageRuler Prestained Protein Ladder (Thermo Scientific, Gdańsk, Poland) is applied. The protein molecular mass is indicated in kDa. Investigated dlps are marked by arrows on gel blots. Significant alterations from triplicate detection in (A), (B) and (C) are marked with asterisks: ***, p < 0.001, **, p < 0.01, *, p < 0.05 versus control values for each cultivar. Further data in the text.

