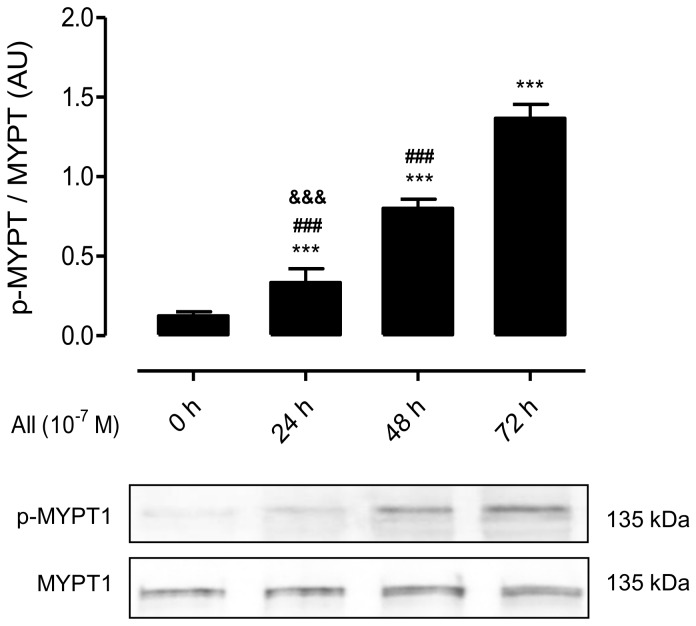
Figure 2.
AngII increases phosphorylation of MYPT1 in MES-13 cells. Graphs showing the phosphorylation of MYPT1 evaluated by western blot analysis in MES-13 cells exposed to AngII (10−7 M) for different times (0, 24, 48 and 72 h). Each bar represents the mean value ± SE of 4 independent experiments. Statistical significance *** p < 0.001 vs. 0 h; ### p < 0.001 vs. AngII 72 h; &&& p < 0.001 vs. AngII 48 h. Under the graph are shown representative pictures of p-MYPT and MYPT positive bands and the loading control (α-tubulin).

