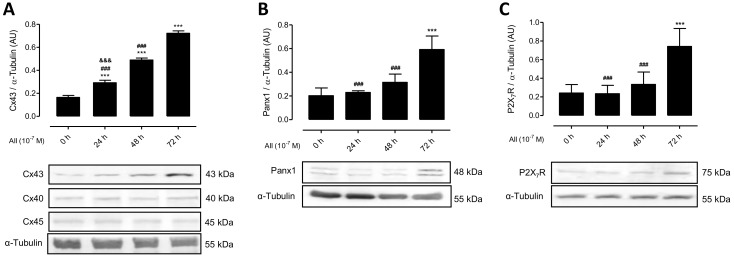
Figure 3.
AngII increases the amount of Cx43, Panx1 and P2X7R in MES-13 cells. Graphs showing the relative amount of different Cxs (Cx40, Cx43 and Cx45 detected as single bands) (A), Panx1 detected as a doublet (B) and P2X7R detected as single band (C) present in the kidney evaluated by western blot analysis in mesangial cells after different times (0 h, 24 h, 48 h and 72 h; Black bars) of treatment with AngII (10−7 M). Each bar represents the mean value ± SE of 4 independent experiments. α-tubulin was used as loading control. Statistical significance *** p < 0.001 vs. 0 h; ### p < 0.001 vs. AngII 72 h; &&& p < 0.001 vs. AngII 48 h. Under the graph are shown representative pictures of Cx43, Cx40, Cx45, Panx1 and P2X7R positive bands and loading control (α-tubulin).

