Figure 5.

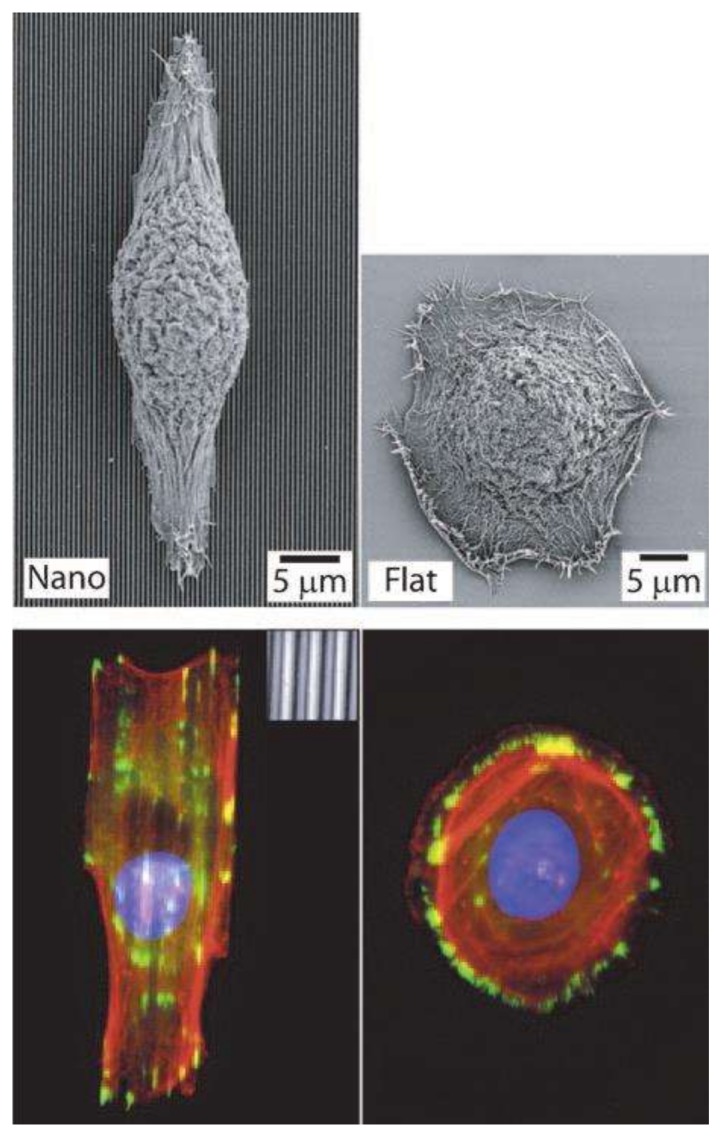
Epithelial cell response to nanograting. Fluorescence (bottom) and SEM (top) images. Arrangement and alignment along the grid axis. Reproduced with permission from the Company of Biologists [114].

Epithelial cell response to nanograting. Fluorescence (bottom) and SEM (top) images. Arrangement and alignment along the grid axis. Reproduced with permission from the Company of Biologists [114].