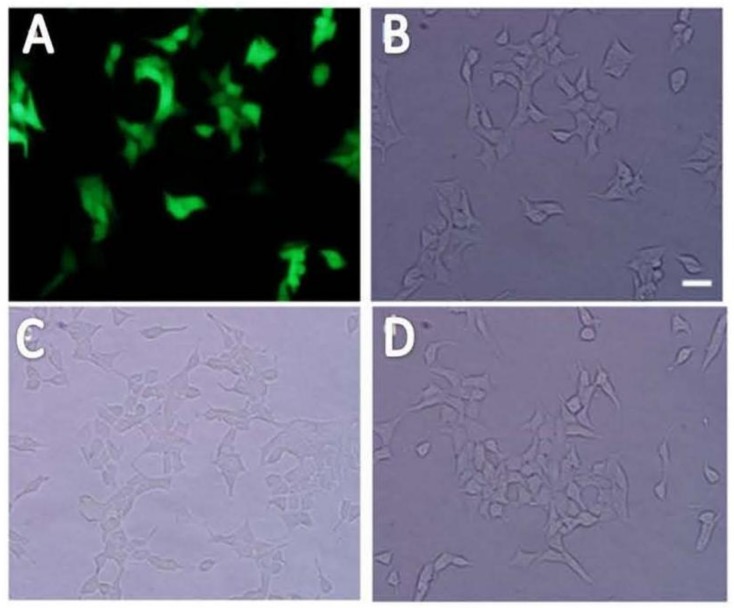
Figure 2.
The morphology of transduced INS-1 cells. The transduced INS-1 cells showed strong green fluorescence (A) under a fluorescent microscope. The same view of the cells under white light field (B) show the cell morphology of transduced cells, indicating most of the cells were GFP-positive. From the view of morphology under the light microscope, the control un-transduced INS-1 cells (C) and InsRβKD INS-1 cells (D) were no much differences. The scale bar is 50 μm and all images share the same scale.

