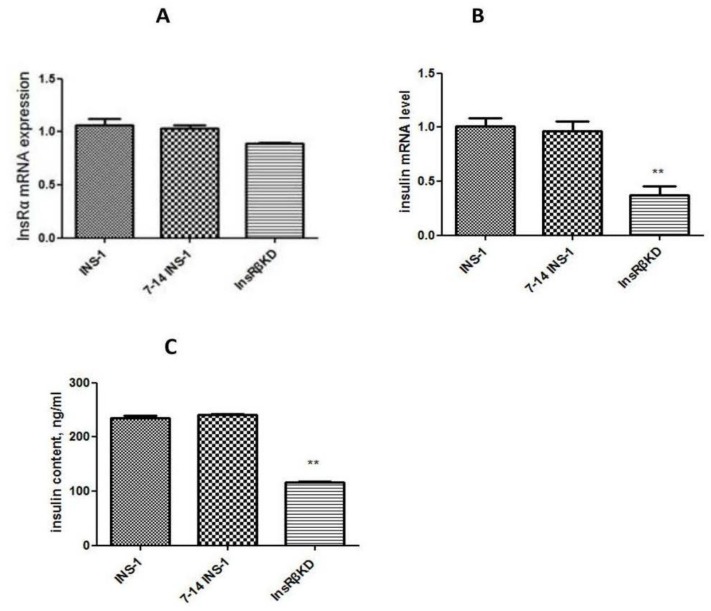
Figure 5.
InsRα and insulin mRNA expression, and insulin content in transduced cells. InsRα (A) and insulin (B) mRNA expressions were measured using qPCR. The mRNA expressions were normalized to that of GAPDH and then to that of INS-1 cells. (C) ELISA result of insulin levels in INS-1, 7-14 INS-1, and InsRβKD cells. InsRβKD cells showed a reduction of insulin levels compared to the controls. ** p < 0.01, n = 3.

