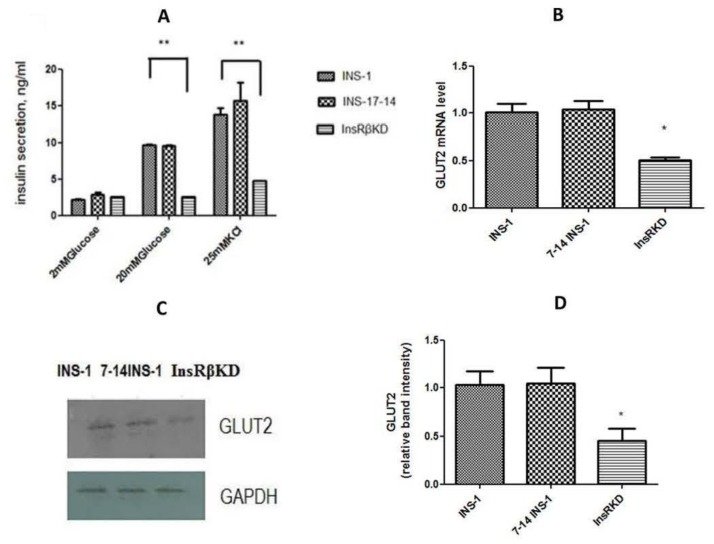
Figure 6.
GSIS and GLUT2 expression in transduced cells. (A) ELISA results of insulin secretion induced by 2 and 20 mM glucose and 25 mM KCl in INS-1, 7-14 INS-1, and InsRβKD cells. Compared to controls, InsRβKD cells showed significantly reduced insulin secretion at 20 mM glucose and 25 mM KCl stimulations. (B) GLUT2 mRNA expression by qPCR analysis, which was normalized to GAPDH expression and then to that of INS-1 cells. (C) A representative result of Western blot analysis for GLUT2 protein expression. (D) The densitometry analysis of band intensity of GLUT2 relative to GAPDH. * p < 0.05, ** p < 0.01, n = 3.

