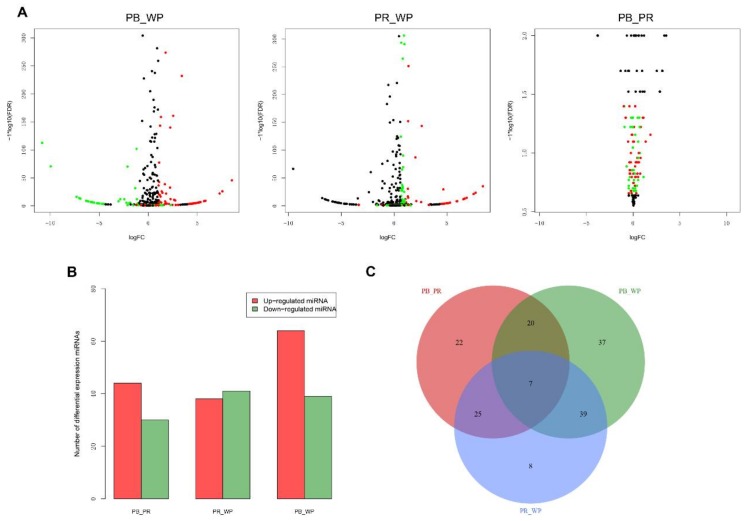
Figure 2.
Differentially expressed miRNAs (DEMs) in three pairwise comparison groups. (A) The volcano plots of three pairwise comparisons. Dark, red, green dots represent non-significant, up-regulated and down-regulated miRNA genes, respectively; (B) red and blue indicate the number of up- and down-regulated miRNAs, respectively; (C) Venn diagram of differentially expressed miRNAs.

