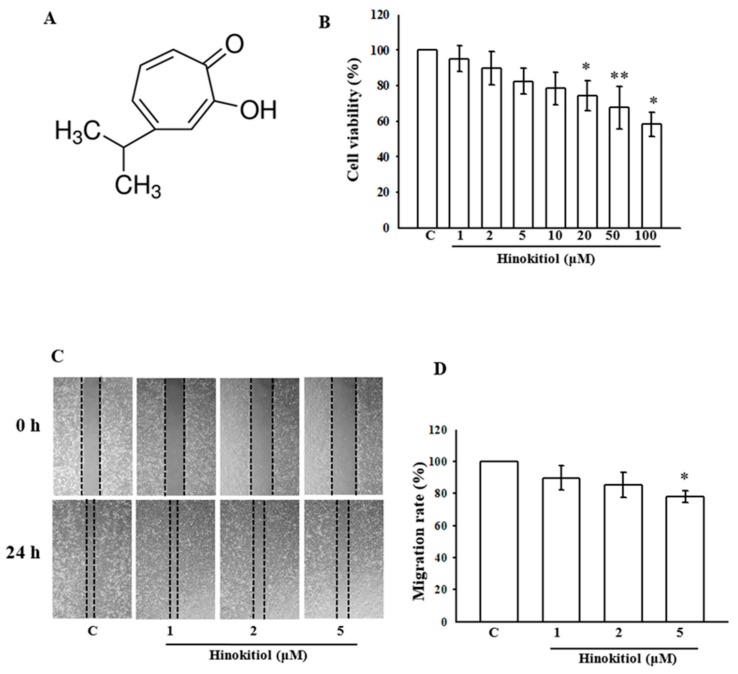
Figure 1.
Effects of hinokitiol on the cell viability of the A549 cell line: (A) the structure of hinokitiol; (B) the viability of A549 cell line during treatment with various concentrations (1~100 µM) of hinokitiol; (C,D) effects of hinokitiol on A549 cell migration after 24 h of exposure. The figures are representative examples of three independent experiments. * p < 0.05 and ** p < 0.01 compared with untreated A549 cells.

