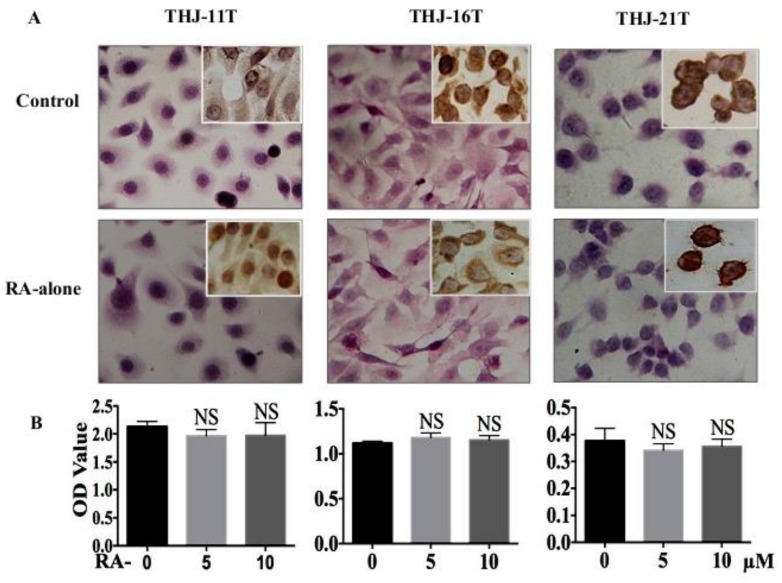
Figure 1.
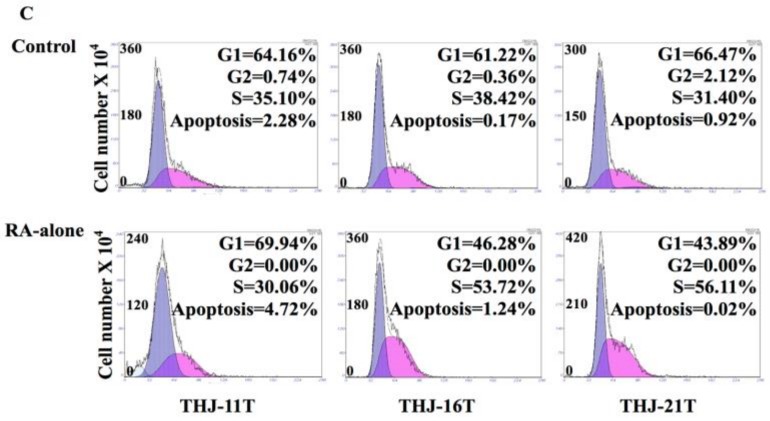
Lack of response of the three anaplastic thyroid cancer (ATC) cell lines to 10 µM retinoic acid (RA) treatment. (A) H/E staining (×40) and Cyclin D1 immunocytochemical staining (insets; ×40); (B) 3-[4,5-Dimethylthiazol-2-yl]-2,5-diphenyl-tetrazolium bromide (MTT) cell proliferation assay; (C) flow cytometry. Control, without resveratrol treatment; RA-alone, 10 µM retinoic acid treatment. NS, without statistical significance (p > 0.05); the error bars, the mean ± standard deviation;  , apoptosis peak;
  , G1 phase;
  , S phase;
  , G2 phase.


