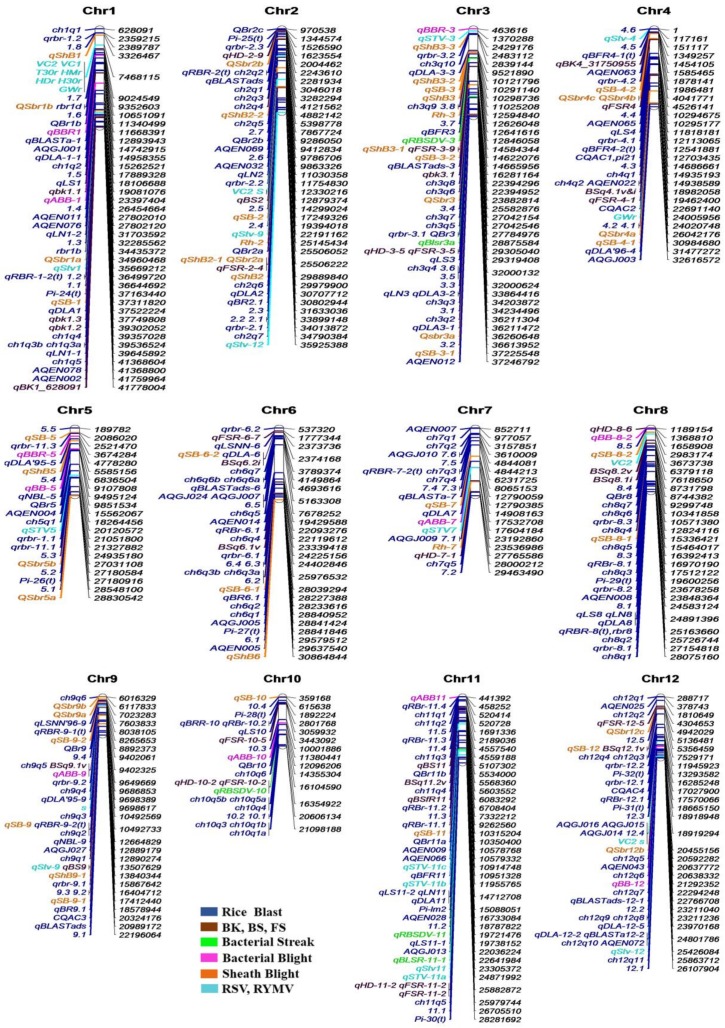
Figure 4.
QTLs distribution on rice chromosomes. Separate color codes are given for each group of QTLs. The physical distribution of QTLs is derived by the nearest linked molecular markers on each chromosome. BK, BS, FS, RSV and RYMV represent Bacterial Streak, Brown Spot, False Smut, Ricestripe virus and Rice yellow mottle virus resistance QTLs, respectively.

