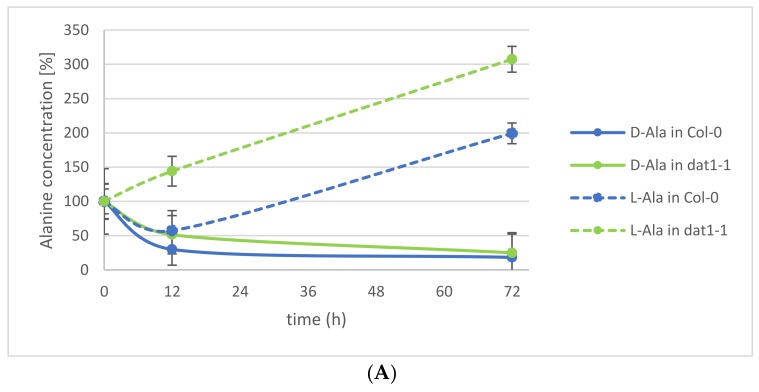
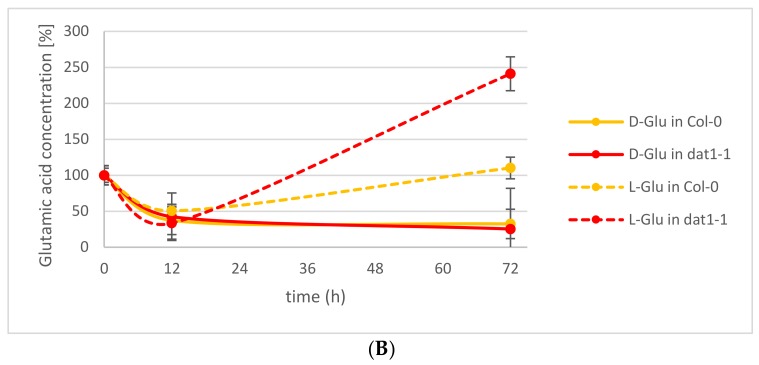
Figure 2.
Relative alanine and glutamic acid concentrations in Col-0 wild-type and dat1 mutant line (dat1-1) seedlings within 72 h. Seedlings were exogenously applied with (A) d-Ala and (B) d-Glu, and their d- and l-Ala or d- and l-Glu contents were determined, respectively. Solid lines mark the d-enantiomer; dotted lines the l-enantiomer. In (A), blue lines represent Ala from Col-0; green ones Ala from dat1-1. In (B), yellow lines represent Glu from Col-0; red ones Glu from dat1-1. Error bars: ± SD.


