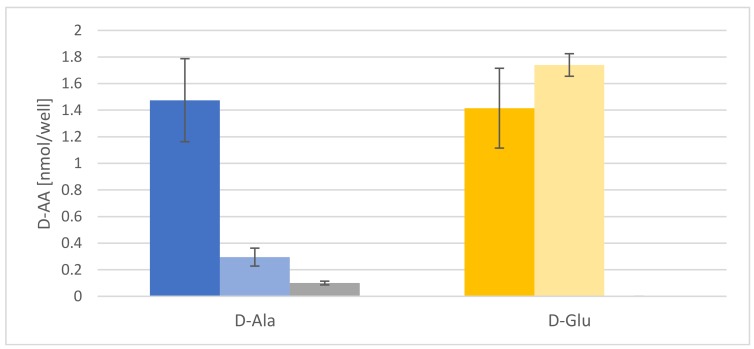
Figure 3.
Contents of d-Ala and d-Glu in media released by Arabidopsis seedlings treated with both d-AAs. Dark blue and light blue bars represent d-Ala content per well 12 and 72 h after transfer from the d-Ala application medium to fresh medium, respectively. The grey bar represents the 72 h values for media from control plants without d-Ala treatment. Dark-yellow and light-yellow bars represent d-Glu concentration per well 12 and 72 h after transfer from the d-Glu application medium to fresh medium, respectively. d-Glu was not detected in the medium of untreated plants. Error bars: ± SD.

