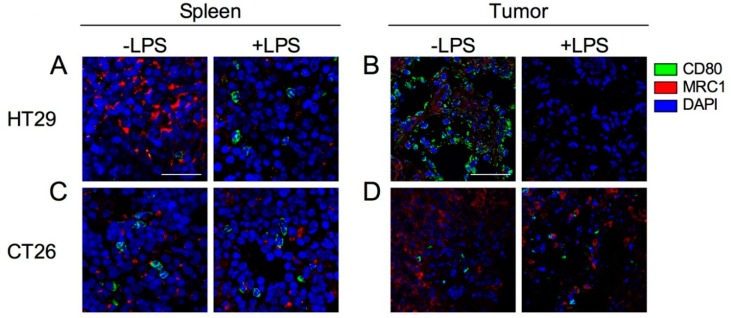
Figure 6.
Confocal images of CD80 and MRC1 expression cells in spleen and tumor with or without injection of LPS. HT29 and CT26 tumor-bearing mice were treated with LPS (+LPS) or PBS control (−LPS) on the day 21 from tumor transplantation and tumor and spleen were collected after 24 h from LPS treatment. (A) Spleen in HT29 tumor-bearing mice. (B) Tumor in HT29 tumor-bearing mice. (C) Spleen in CT26 tumor-bearing mice. (D) Tumor in CT26 tumor-bearing mice. CD80, MRC1, and cell nuclei (DAPI) are represented in green, red, and blue, respectively. Representative images from at least three independent experiments are shown. Each scale bar indicates 50 μm.

